Terminal QRS Distortion
*(C) 2023 Vernon R Stanley, MD, PhD
In this blog post, we will compare four tracings as outlined below.
Following the analysis of these 4 tracings, we will present a guideline to aid you as you search for the STEMI especially when the differential diagnosis has been narrowed down to the acute STEMI vs a benign early repolarization pattern.
This is a sobering task since one patient will be referred to the cath lab and the other might be discharged home or simply admitted for observation. The patient’s disposition hinges on your interpretation.
Please refer to the ECG below as an example of a Classic Normal ECG. Let us focus on the terminal portion of the QRS complexes. Specifically, I want you to note the following:
- The right-most precordial leads V1, V2, V3 take on an rS configuration (r << S in Lead V1)
- The left-most precordial leads V4, V5, V6 take on a qR configuration (depth of q << R in Lead V6)
The dominance of these voltages fluctuate as you go back and forth across the precordium i.e. crescendo and decrescendo of the R-wave and S-wave. We acknowledge this phenomenon when we refer to R-wave progression noting that the hypothetical position on the precordium where R = S is the transition zone. It is clearly true that the transition zone of this tracing lies between Lead V3 and Lead V4. We will agree that the normal transition zone occurs between Lead V2 and Lead V4 inclusive. The transition zone of this tracing is therefore normal.

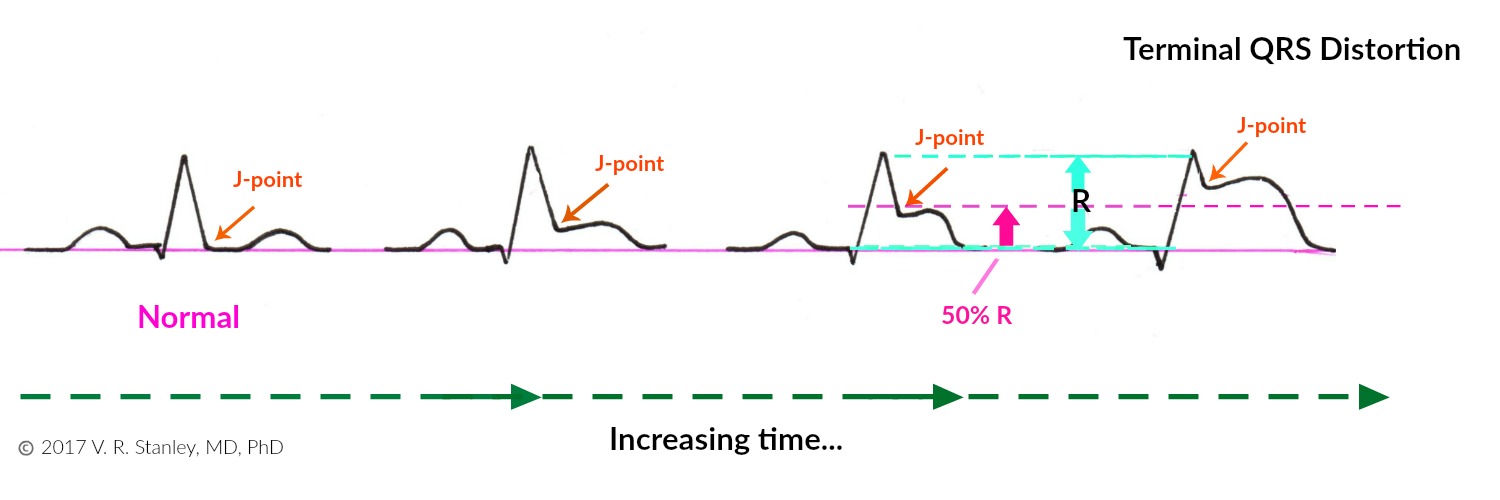
Sometimes during the evolution of the acute Anterior STEMI, you will see the terminal S-wave begin to rise toward the baseline. When the terminal S-wave rises above the baseline then it technically is no longer an S-wave. When this occurs, it is described as “terminal QRS distortion”. This is highly suspicious of the Acute STEMI (this statement holds especially true of Leads V2, V3).
NOTE: An exception to this rule occurs when the takeoff of the J-point forms the shape of a “fish hook” (J-wave). If this J-wave is present, the probability shifts in the direction of a benign normal variant (early repolarization).
The rising of the nadir of the S-wave is demonstrated in the Illustration below:

Similarly, if the QRS complex takes on a qR configuration, you might observe the following phenomena. As the acute STEMI evolves, the J-point take off will rise with time. When the J-point rises to > 50% the R-wave height it is called “terminal QRS distortion”.
This is highly suspicious of the acute STEMI (this holds especially true of Leads V5, V6; the exception again occurs if a J-wave is present). This rising of the J-point is shown schematically in the Illustration below.
NOTE:
Please note the two Illustrations above and focus on the ST-segments and particularly note that I have depicted the STs as concave down. Be aware that most commonly the ST-elevations of the acute STEMI are indeed concave down; however, they certainly might be concave up. When this occurs you can see why this might be problematic to decide whether a given tracing is one of a STEMI or a benign early repolarization pattern.
We will now compare four tracings using the following chart (see below chart for ECG Tracings):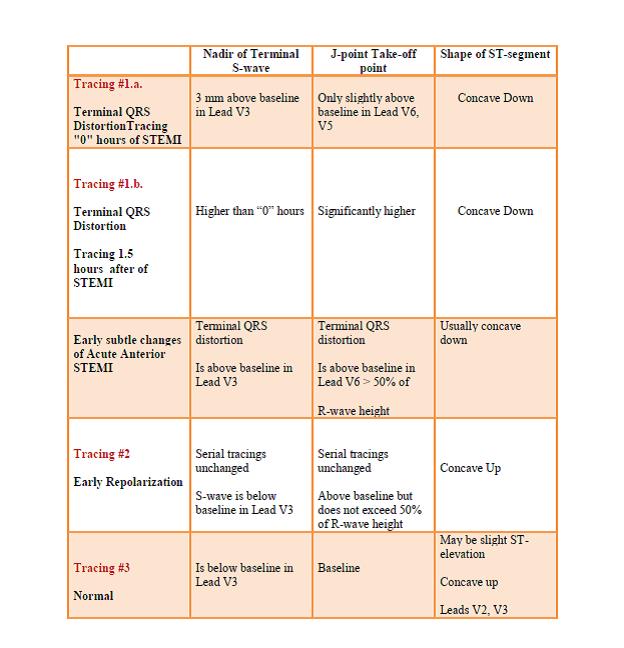
Tracing #1.a Hour “0”
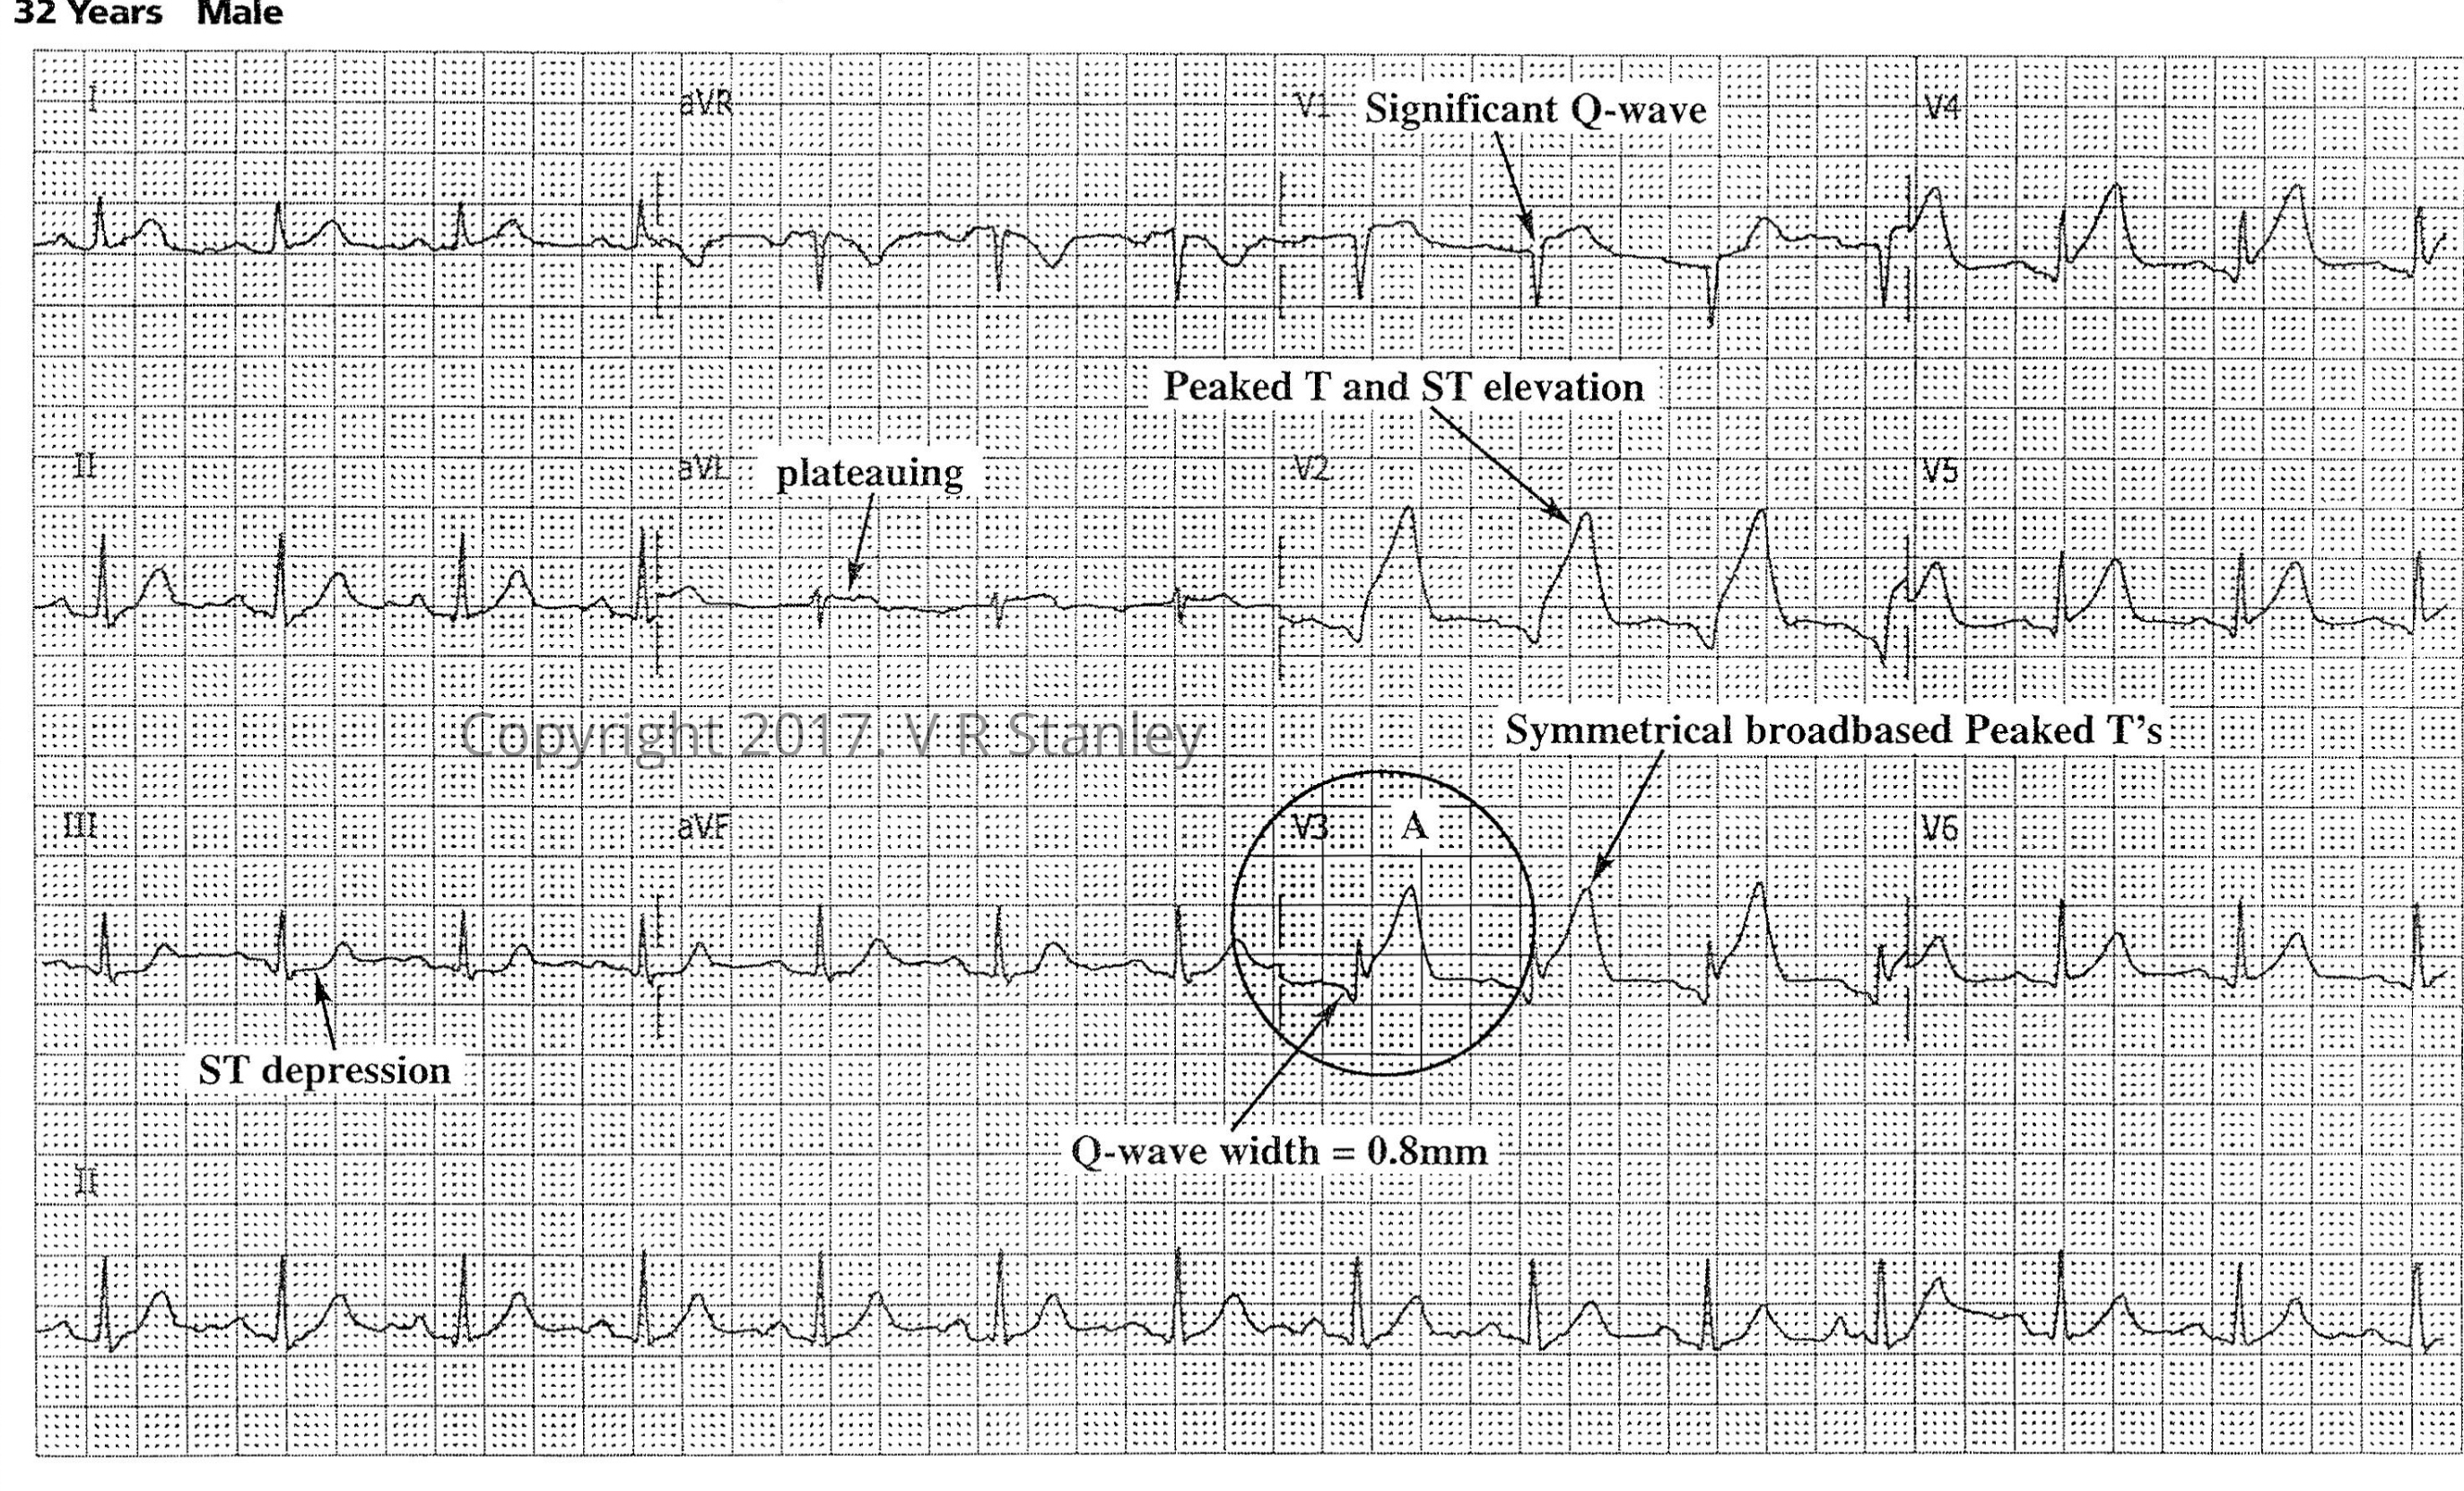
Tracing #1.b. – at “1.5” hours evolving STEMI (same patient)

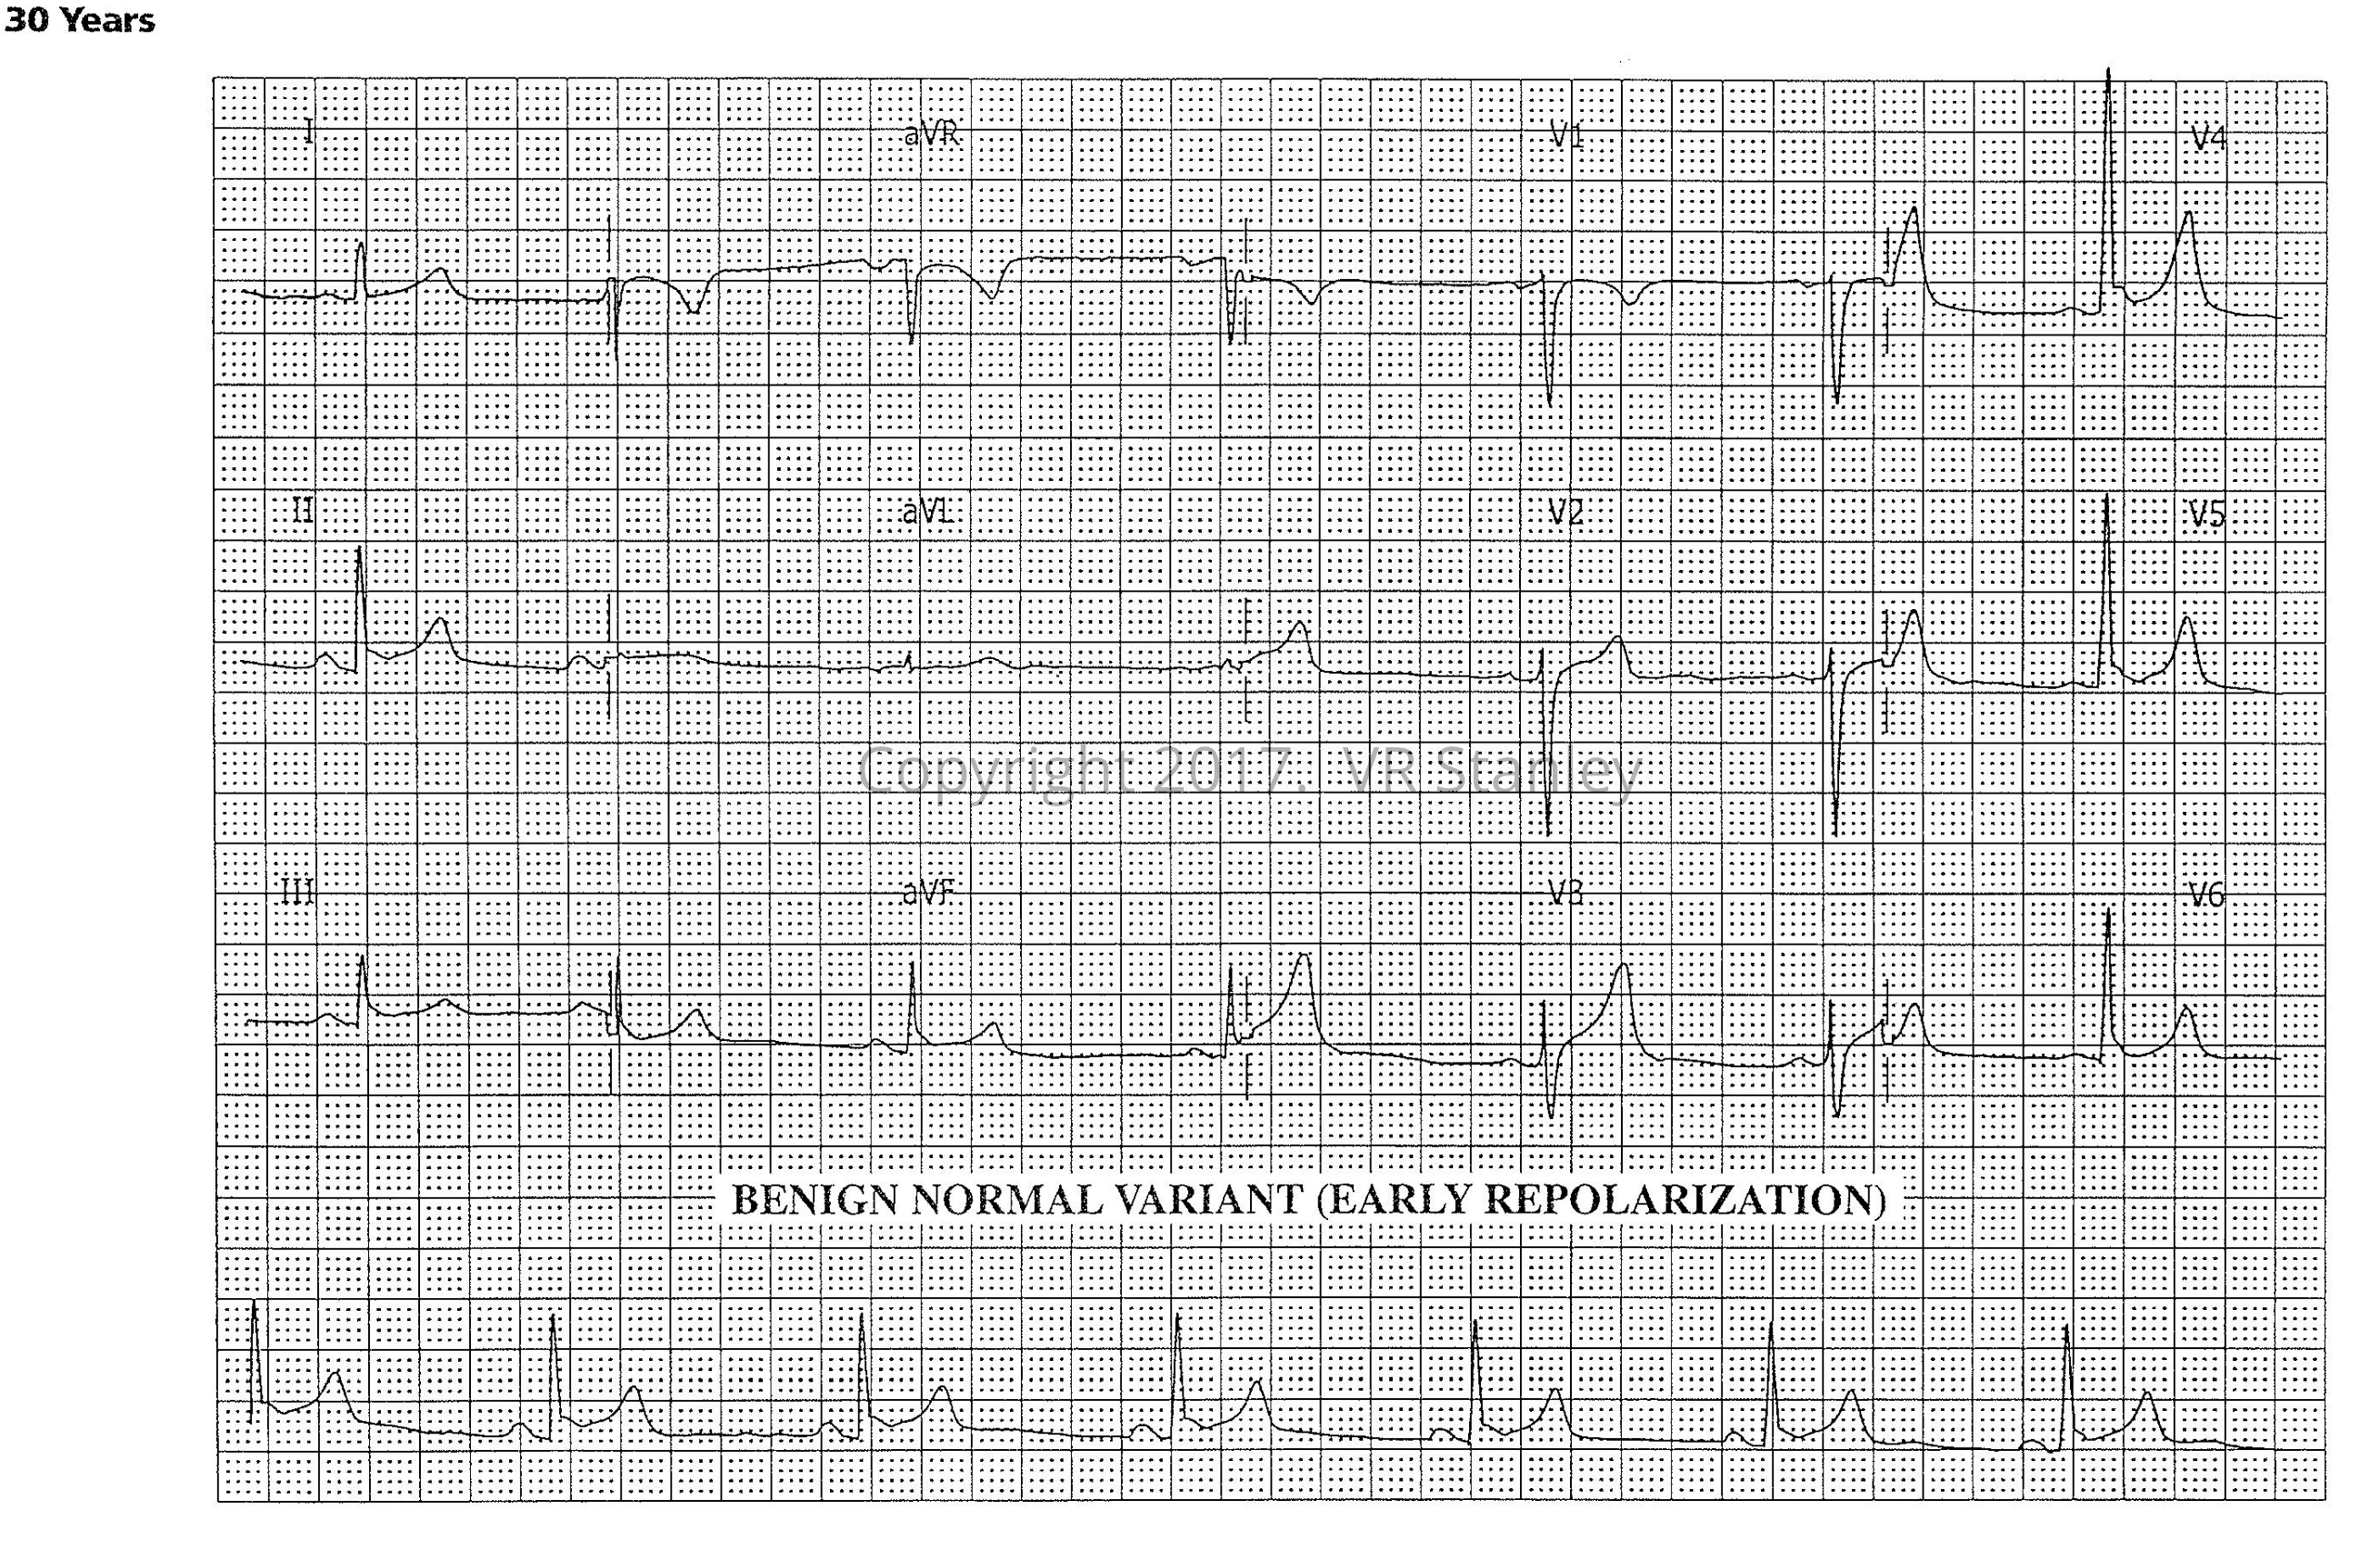
Tracing #2 – Early Repolarization (Benign Normal Variant)
Tracing #3 – Normal ECG
Conclusion: When faced with the challenge of deciding whether a given tracing is early repolarization or acute STEMI (especially if the changes are subtle), look for “terminal QRS distortion”. If present, it is highly suspicious for the Acute STEMI.
CLINICAL PEARL:
The discussion below is especially useful when the changes on the cardiogram are subtle.
In your search for the acute STEMI (ST Elevation MI), you will frequently be faced with the uncomfortable differential diagnosis of:
- Acute Anterior MI OR
- Benign Normal Variant (early repolarization)
This look-alike scenario occurs because we know that frequently the ST-segment elevations of the acute MI are concave up (catenary shaped)[ although more often than not they are concave down (tombstone –like)] as is the early repolarization pattern. This concave “upness” across the precordium can make these two patterns very much look alike such that only the discriminating eye can unravel.
At this juncture, I advise you to consult with two Leads: Lead V2 and Lead V3
- If terminal QRS distortion is present in Lead V2 or Lead V3 AND
- If J-wave is absent in both Leads →→→→ It is highly probable that the interpretation is “Acute STEMI” (LAD artery occlusion).
*Terminal QRS distortion is defined as absence of S-wave (S-wave has risen above the baseline).
As always you must adhere to a strict regimen of:
- Clinical correlation
- Comparison with old tracings and old medical records
- Serial tracings, cardiac markers as needed
*Referenced from the following:
https://hqmeded-ecg.blogspot.com/2015/10/best-explanation-of-terminal-qrs.html steve smith MD 2015
https://hqmeded-ecg.blogspot.com/2015/10/best-explanation-of-terminal-qrs.html 2015
https://hqmeded-ecg.blogspot.com/2016/11/paper-published-terminal-qrs-distortion.html 2016 Steve Smith MD
https://www.ncbi.nlm.nih.gov/pubmed/27658331 Lee et al.
DH Lee, B Walsh, SW Smith – … American Journal of Emergency Medicine, 2016
Next month’s blog: Atrial Fibrillation
One Response