– Vernon R Stanley, MD, PhD | Co-editor C Stanley, PA-C | Renewed (C) 2024. All rights reserved.
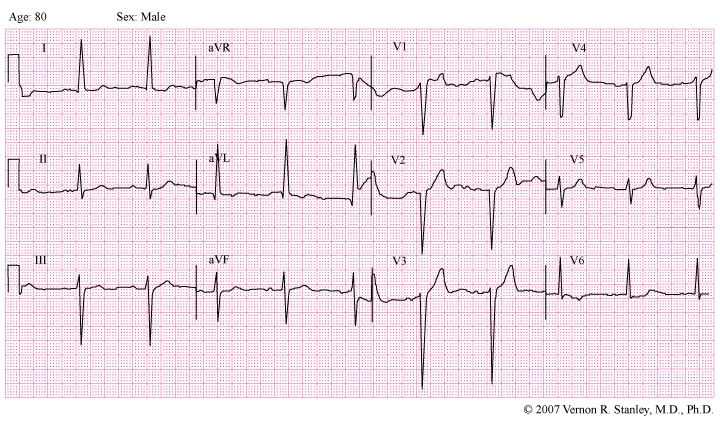
You are working as a physician associate at a summer resort in Big Sky Resort, MT, USA. An 80-year-old male walks into your clinic with complaints of chest tightness. He is cold, clammy, diaphoretic. Your ECG interpretation and/or treatment would be:

Choose from one of the following answers below (answer at bottom of blog post):
A. This is most certainly a septal MI as evident by the significant Q-wave of V2
B. This tracing represents lateral/high lateral ischemia as seen by the ST depressions and downsloping seen in avL
C. This is simply LVH with ST-T changes (strain) and the patient should be discharged home
D. This patient needs further clinical and laboratory evaluation and comparison with an old ECG

INTERPRETATION
- LVH with ST-T changes (strain)
- Peaked T’s and ST elevation and significant Q’s in Leads V1 andV2.
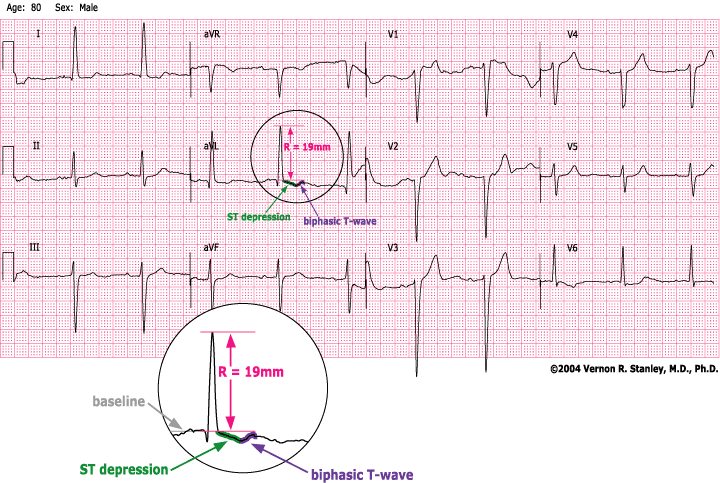
- ST depression and T-wave inversion Leads V6, I, aVL , II
DISCUSSION:
Please know that an old tracing was available. When compared, they are virtually identical.
The focus of this Case Study is the LVH pattern and its associated ST-T changes. This tracing is a particularly good example of ST-T changes that mimic the Acute Anteroseptal MI.
First let us analyze the tracing utilizing the acronym H*E*A*R*T.
HEART ACRONYM ANALYSIS.
H……….Hypertrophy
- Lead V3…..S = 35 mm
- Lead V6…..R = 12 mm
- Therefore R + S = 35 + 12 =47 mm
- No evidence of Right Atrial Enlargement (RAE)
- No evidence of Left Atrial Enlargement (LAE)
E……….Extent of intervals
- PR-interval———————–normal
- QRS duration——————–0.08 sec (normal)
- QT interval ———————-normal
A……….Axis
- Lead I is positive
- Lead aVF is negative
- Therefore the electrical axis of the frontal plane is between 0 and -30 since lead II is positive
R……….qRs-st analysis
- Notice the significantly wide Q-waves in Leads V2. This might ordinarily suggest a myocardial infarction (age unknown). However in the case of the LVH pattern it is more likely to be a part-and-parcel of the LVH pattern i.e.
it is a pseudoinfarction pattern.
The Transition Zone is between Leads V6 and V5 (late)
Note the poor R-wave progression
Note the peaked T-waves (concave down) especially in Leads V1, V2 and V3. This would ordinarily be suspicious of the acute ST elevation MI but in the case of the LVH pattern it is most likely a pseudoinfarction pattern.
Note the ST depression (ramplike, down sloping) especially in Leads V6, V5, I, II and aVF. These findings would ordinarily suggest myocardial infarction, ischemia or changes of reciprocity, but in the case of the LVH pattern these changes are most likely secondary to the LVH i.e. “LVH with ST-T changes (sometimes called strain)”.
T……….T-waves
- peaked T’s noted in Leads V1, V2, and V3
- T-wave inversion noted in Leads V5, V6, I, aVL and aVF
- biphasic T’s noted in Lead lI
- flattened T’s noted in Lead III
LESSON NOTE ON Q-WAVES AND ST-ELEVATION ASSOCIATED WITH THE LVH PATTERN
The focus of this Case Study tracing is to emphasize changes often found secondary to the LVH pattern. This tracing is a particularly good example of significantly wide Q-waves and ST elevation concave down commonly found in Leads V2, and V3. These observed ST-T-Q wave changes look like those of reciprocity, but in fact these changes are probably pseudoinfarction changes.
You can clearly see how one might misinterpret this cardiogram as an acute STEMI. This potential catastrophe can be avoided or minimized by being proactive with your thinking when you recognize the LVH pattern i.e.
Be particularly vigilant with your interpretation regarding Leads V1, V2 and V3. These three leads will frequently demonstrate ST-T-Q waves that will mimic the acute ST elevation MI. The recognition of these changes associated with the LVH pattern should automatically trigger your mentality to:
- Always ask to to see the old cardiogram. This might inform you that these ST-T-Q wave changes are old. This will swing you in the direction to simply conclude:
“LVH with ST -T changes”
2. As a safety net of hedging, please know that it is wise to acknowledge that the observed changes could be a combination of:
a…..LVH with ST-T changes
AND
b…..ST-T-Q changes of the acute STEMI/non-STEMI or myocardial ischemia
CLINICAL PEARL: In a given situation the practitioner must correlate clinically in order to determine the interpretation and disposition response i.e. is it simply LVH with ST-T changes or is there associated ischemia and/or infarction? This screening decision is made by careful analysis of the history, physical exam, X-ray, coronary risk factors, comparison with the old ECG and lab studies including the cardiac markers.
Answer: D. This patient needs further clinical and laboratory evaluation and comparison with an old ECG.
Want further discussions on the 12-lead ECG? Try one of our recommended courses below. 15% Off & Free Ship with code BKTS14 at Checkout through 9.7.21

1 Response