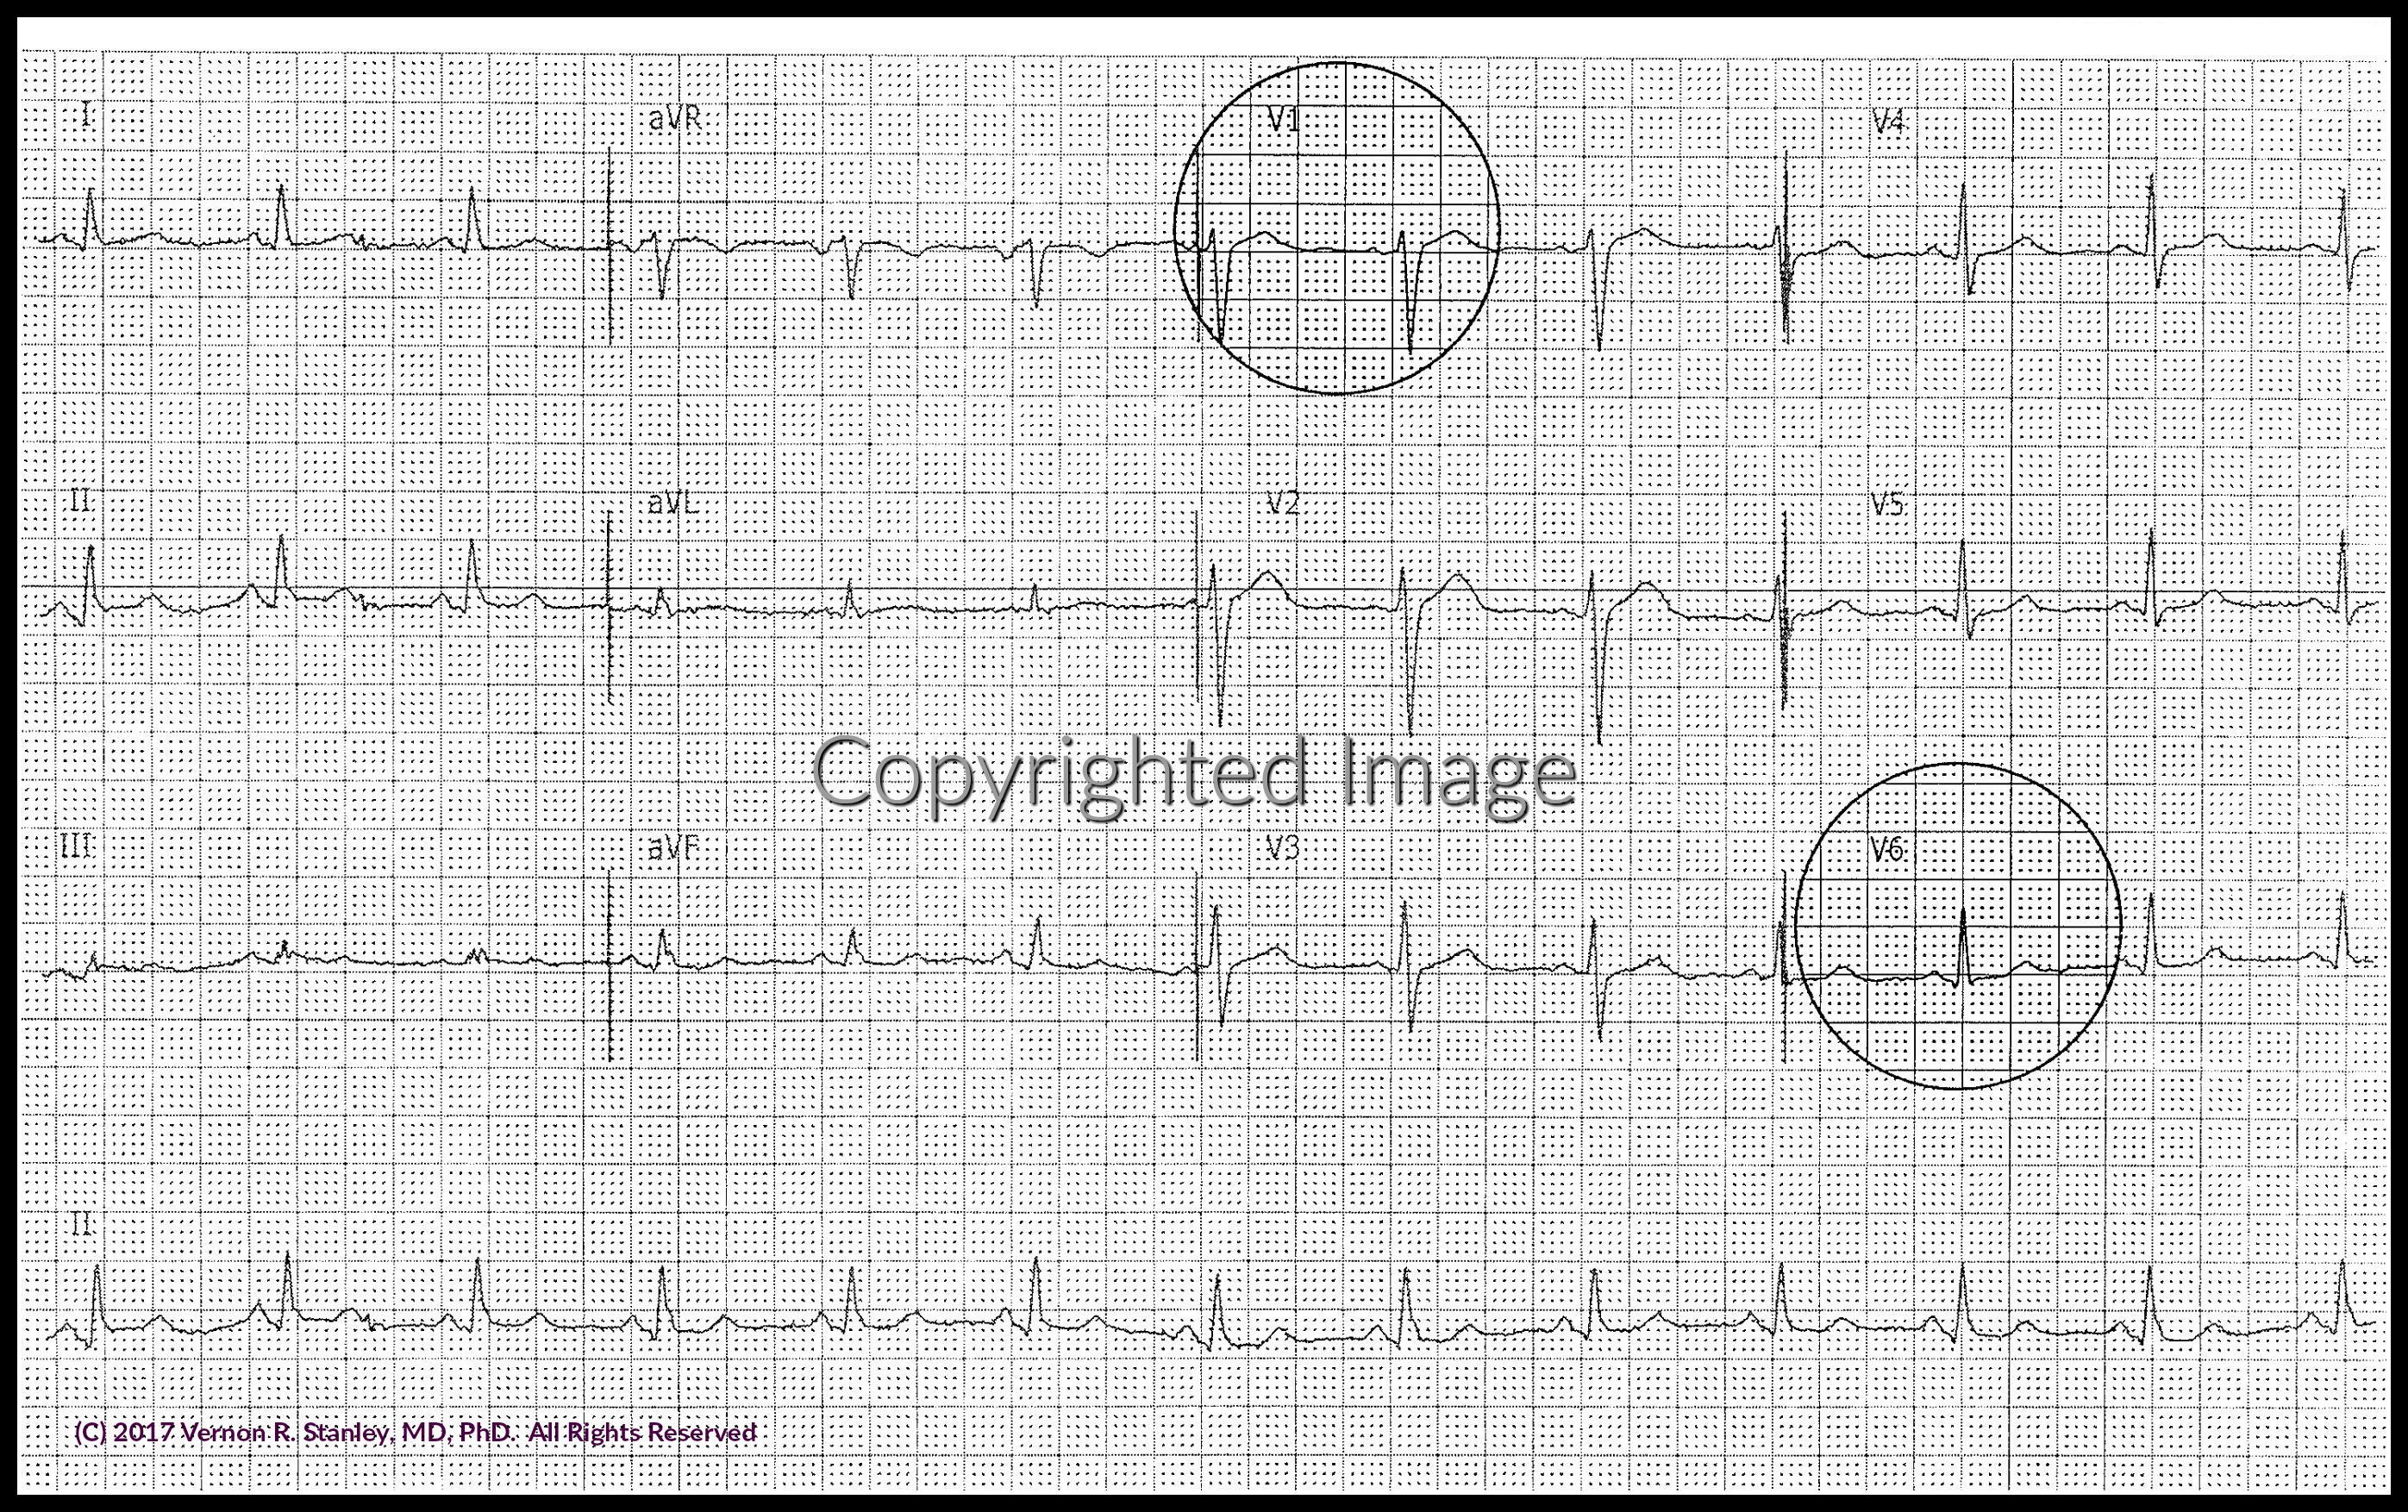
For the present time let us look at the two circled leads V 1 and V 6 only. For Placement of the Electrodes See Image:

Referencing the above “NORMAL” ECG we will review the following….
In this illustration below:
t 3 = time of initiation of depolarization of septum
You will recall that the septum is generally depolarized in a rightward-downward direction. Since the Lead V 1 lies on the rightmost side of the chest, the depolarization wavefront would be going toward the electrode. Hence we would predict that the initial deflection of Lead V 1 would be UP. This is indeed the case as shown in Illustration #9.

Illustration #9
- t 4L = time of initiation of depolarization of Left Ventricle.
- t 4R = time of initiation of depolarization of Right Ventricle.
You must be aware that the two ventricles depolarize in opposite directions as follows:
Right Ventricle voltage——-depolarizes dominantly toward the Right
Left Ventricle voltage——– depolarizes dominantly toward the Left
This concept is shown schematically in Illustration #11 that follows. This principle will be utilized to predict the cardiogram waveshape following the depolarization of the LV and the RV.


Illustration #11
This Illustration #11 above is analogous to two people pulling on a rope in opposite directions. The giant person (Left Ventricle) will clearly dominate the tiny person (Right Ventricle), and the resultant pull of this rope -pulling contest will be in the direction of the giant (Left Ventricle).
Note: Recall that a vector is characterized by its direction (as indicated by the arrow) and magnitude (length of arrow).
Pearl: We know that the dominate mass of the ventricles is the LEFT ventricle. It would seem logical that the larger the mass, the larger the voltage supplied by that mass. This indeed is generally true and we can conclude that since the LEFT ventricle far dominates the mass of the RIGHT ventricle, the relative voltages would compare as follows:
- LEFT ventricle———— huge voltage
- RIGHTventricle———– tiny voltage
In this illustration below:
- t 1 = initiation of depolarization of atria.
- t 5 = initiation of repolarization of ventricles.

A Summary Conclusion is as follows:
The Waveform of Lead V 1 consists of two components —
1 . Initial small upward deflection contributed by the Septum.
2 . Followed by LARGE downward (green) deflection contributed by the Right ventricle and Left ventricle (primarily by the LEFT).