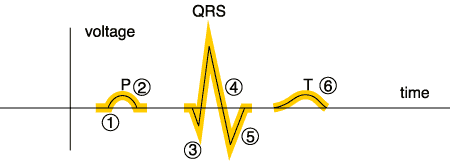
The electrical signal initiates in the SA node, depolarizes the Atrial myocardium, depolarizes the AV node, propagates through the Bundle of HIS, and terminates in the Purkinje cells, depolarizes the Ventricular Myocardium (endocardium to the epicardium). The tissues then recharge (repolarize) and the SA node discharges again and the cycle repeats itself.
Where:
1 =time at depolarization of SA node
2 =time at depolarization of AV node
The resultant electrical signal is as follows:
P = Depolarization of the Atria
QRS = Depolarization of the Ventricles
T = Repolarization of the Ventricles
Note: The depolarization of the SA node (at 1) and the AV node (at 2) produce only a tiny voltage and will not be visible on the standard rhythm strip.
Below is an animated tutorial of the Normal Sinus Rhythm. Click on numbers 1 – 8 to view the animation of the electrical activity in the heart with the resultant wave form. Each region of the heart has been color coordinated to the rhythm strip for signal origin analysis. You may also click on “Play Rhythm” and “All Labels” to play the entire rhythm and review a detailed breakdown of the signal origins.
[kml_flashembed publishmethod=”static” fversion=”8.0.0″ movie=”https://ecgcourse.com/wp-content/uploads/2016/04/normal_sinus_rhythm.swf” width=”800″ height=”600″ targetclass=”flashmovie”]
[/kml_flashembed]


