(C) 2024 ECGcourse.com LLC. All rights reserved. | Author: Vernon R Stanley, MD, PhD | Editor: Courtney Stanley, MS, PA-C
In this month’s post we will explore the use of Dr. Stanley’s H-E-A-R-T Mnemonic to interpret the 12-lead ECG and distinguish between patterns of the LBBB (Left Bundle Branch Block) versus RBBB (Right Bundle Branch Block). The two ECG patterns, LBBB vs RBBB, have many similarities; however, clinically the recognition may greatly change the treatment and patient care management. TT
Now please answer the following 3 questions before reading this blog post. Answers will be highlighted at the bottom of this page.
Q1. True or False: In the LBBB ECG pattern, concordance of the QRS-T waves is sometimes suggestive of myocardial ischemia/infarction.
- A. True
- B. False
Q2. An ECG which demonstrates a RBBB (Right Bundle Branch Block) and LAFB (Left Anterior Fascicular Block) is also commonly referred to as a _________________:
- A. Bipedal Block
- B. Bifascicular Block
- C. Trifascicular Block
- D. None of the above.
Q3. A normal QRS duration “|QRS|” is:
- A. Anything greater than 0.21 sec
- B. Between 0.12-0.20 sec
- C. Less than or equal to 0.10 sec
The HEART Mnemonic: A Systematic, Analytical Approach to interpreting a 12-lead ECG
Let us now begin our systematic, analytical approach to 12-lead ECG interpretation using Dr Stanley’s HEART Mnemonic consisting of looking at each letter of the acronym HEART as follows:
- Hypertrophy
- Extent of the Intervals
- Axis
- qRs-ST Analysis
- T-wave
NOTE: As we address each letter of the HEART mnemonic, if you have a hard copy, please lay the Dr Stanley’s laminated HEART Ruler Mnemonic on the desk in front of you for continual reference. (To learn more about this item or to purchase for a single provider or group: ECG Interpretation Cheat Sheet Mnemonic – ECGcourse.com )
H = HYPERTROPHY
The letter “H” of this HEART mnemonic will function as a prompter to look for HYPERTROPHY. In this post, we will limit our search to LVH (Left Ventricular Hypertrophy) in patients 35 years old and older. Please note, some providers use a varied age cut off; but suffice it to say that here we will decide on patients 35 years of age and older.
You will encounter the LVH pattern daily in your practice and therefore you must choose a criterion by which you make the diagnosis. The realization is that there are multiple diagnostic criteria, no one criteria being “the Best”. In fact, they all possess undesirable qualities such as poor sensitivity, poor specificity or being too unwieldy. It therefore seems that we must choose those Criteria from this list which give acceptable levels of both specificity and sensitivity and at the same time be user friendly. (It is clearly true that if another Criteria, with higher Specificity and Sensitivity, is known but it is too unwieldy, or you simply cannot remember it on a daily basis. It is not the Criteria for you). The criteria we will agree upon is as follows:
- R + S = or greater than 35 mm. (largest R of V6 V5 V4 and deepest S of V1 V2 V3 ) and/or
- R -Wave in Lead avL = or greater than 12 mm * We certainly know that there are other hypertrophies (RVH, RAE, LAE) and these do occur commonly. However, for the purposes of this primer we will defer this discussion and I refer you to my Text (Appendix page 12-17) for the details of their Criteria and recognition.
E = Extent of the Intervals
The letter “E” will serve as a prompter to measure the three intervals as follows: PR-Interval | QRS Duration | QT-Interval. A mini discussion of their definition and importance are as follows below:
PR-Interval
Onset of P-Wave to onset of QRS complex Normal range = (0.12 – 0.20) sec.
The two findings to be on the lookout for are as follows:
Long PR—– i.e. greater than 0.20 seconds, then 1o AV block (if the other criteria are met)
Short PR —— i.e. PR less than 0.12 sec, you should “think” WPW and proceed to look for the Triad criteria of WPW: 1. Short PR 2. Delta waves present 3. QRS duration widened (greater than 0.10 sec.)
QT-Interval = less than 1/2 R-R interval
If not tachycardic or bradycardic, the normal QT-Interval is given as: NORMAL QT -Interval = or less than 1/2 RR Prolonged QT-Interval = greater than 1/2 RR (if not tachy or brady). Prolonged QT-interval can precipitate Torsades de Pointes
QRS Duration ——– normal width < or = 0.10 sec.
If widened to 0.12 seconds, then you should think LBBB or RBBB and proceed to look for the Triad as follows:
1. LBBB: 1. QRS duration = 0.12 sec (or greater) 2. Lead V4 V5 V6 with RSR’ (slur of notch) 3. Lead I monophasic (all upright) with slur or notch. If the tracing does not meet the criteria of the LBBB or RBBB, then it is best described as an Intra Ventricular Conduction Delay (IVCD).
2. RBBB: 1. QRS duration = 0.12 sec. (or greater) 2. Lead V1 V2 V3 with RSR’ (slur or notch) 3. Lead I biphasic with broad terminal S-Wave
A= AXIS
The electrical axis lies in the frontal plane and is determined from two Lead: Lead I and Lead avF. Therefore, when determining the axis, place your focus on these two Leads only. One of the primary reasons for looking for the axis is that it will uncover the diagnosis of the LAFB with guidelines given below. The most important two scenarios are as follows:
A. Normal Axis ————— positive Lead I and positive Lead avF
B. LAFB ———————- diagnosed with the following Triad: 1. Lead II predominantly negative (also with positive Lead I and negative Lead avF) 2. small R-Wave in Leads II, III, & avF 3. small Q-Wave in Leads I & avL
IMPORTANT PEARL: Most ECG’s done in the office or in the field will have a built-in computer interpretation. It is well agreed that the computer interpretation (while useful as a 2nd opinion) is not accurate or specific enough to direct the treatment of the patient. However, please know that the computer analysis of the electrical axis is usually correct. My advice is therefore: if you are unsure of the axis, look at the computer interpretation, it is probably correct.
R = qRs / ST
The letter “R” of the acronym should serve as a prompt to look for the following: CAUTION! The “R” of the acronym will contain the Lion’s share of information needed as you search for the myocardial infarction/ischemia pattern. However, remember that these findings of ST-T-Q changes must be taken in context of those patterns which are known to distort the cardiogram and muddy the waters with mimics, masks and pseudo changes.
Furthermore: Always compare with the old Cardiogram. As unlikely as it seems, these changes might be a chronic pattern for this patient. Look at all the R-Waves of the precordial Leads, specifically looking for:
R-Wave progression (demonstrating crescendo – plateauing – then decrescendo). Label as “Poor R-wave Progression” if this is absent. Transition Zone —– Normal (V2 V3 V4), Early (before V2), or Late (after V4 ) V trans = precordial location where R = S.
Examine all 11-Leads to confirm absence of significant Q-Waves. If significant Q-Waves (1mm or greater wide) are present, you must ultimately associate them with. Remember: we have agreed to ignore Lead avF Myocardial Infarction (old or acute), LBBB, LVH, WPW, LAFB, IVCD, Normal Variant.
Examine all 11-Leads with a focus on the ST-Segment. ST elevations might be associated with Normal benign variant (especially common in Leads V1, V2, V3), Acute ST- Elevation MI (especially if concave down) LBBB, LVH, Early Repolarization (if concave up, diffuse, and J-Point elevation present), Acute Pericarditis, Ventricular Aneurysm. ST Depressions might be associated with Myocardial ischemia, Non-ST-Elevation MI, ST-Depression of Reciprocity, Digitalis Effect, LVH with ST-T changes (strain), Non-specific.
PEARL: In the absence of LVH and LBBB, if you find ST-Elevation concave down in the associated Leads and ST -depression in the reciprocal Leads. This is virtually diagnostic of the Acute ST-Elevation MI.
A Quick Reference Guide to Leads vs Areas of the Heart is as follows:
AREA ………………………. ASSOCIATED LEADS ……………RECIPROCAL LEADS
Inferior……………………………II, III, avF………………………………….V1 – V6 I avL
Lateral…………………………V 6 V 5 V 4 I avL……………………..V1 V2 V3 II III avF
High Lateral……………………..I avL……………………………………..V1 – V6 II III avF
Right Ventricle ………………. V4R
Posterior ……………………… V8
T = T-wave Analysis
The purpose of the letter “T” of the acronym is to prompt you to methodically examine every T-Wave of the 11-Lead tracing. The awareness factor should be as follows: if the tracing is NORMAL, then the T’s will be as follows:
- 1. All upright (except maybe Leads V1 avL avF III)
- 2. Low profile
- 3. Asymmetrical
If the above characteristics of the T-Wave are violated, then you should search for the possible explanation. This might include the following partial list: Acute Myocardial Infarction or ischemia (includes T- Wave inversion and Hyperacute T ‘s), Chronic Myocardial Ischemia, RBBB, LBBB, IVCD, Juvenile Pattern, Pulmonary Embolus, Non-specific changes, LVH, Normal Variant.
Using HEART Mnemonic to Interpret the LBBB (Left Bundle Branch Block)
Below is the tracing of a 73-year-old female presenting to the Emergency Department with chest pain. It certainly represents an LBBB pattern. What interpretation most accurately describes the relationship between the QRS complex and T-wave?
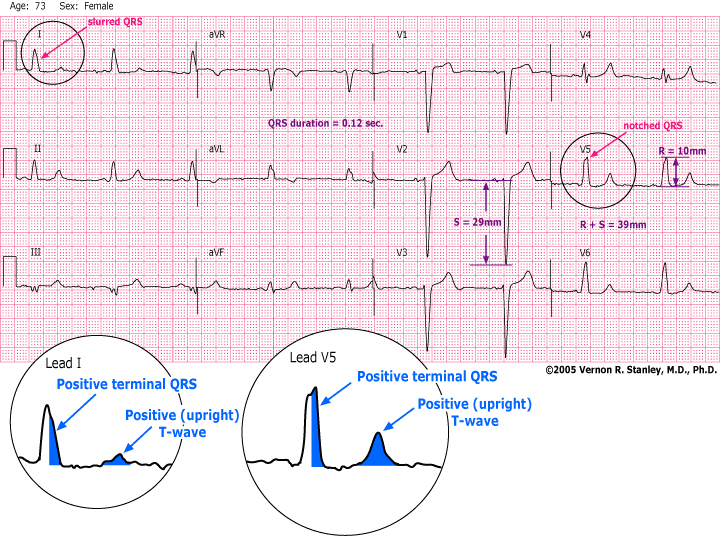
INTERPRETATION:
1. Left Bundle Branch Block.
2. Primary T-wave changes present.
3. In the LBBB patterns, concordance of the QRS-T waves is sometimes suggestive of myocardial ischemia/infarction.
DISCUSSION:
First let us analyze the tracing using the acronym HEART. We will then take these findings and place them in clinical perspective. This will include a discussion of some of the LBBB characteristics including its pseudo patterns, mimics and masks.
“HEART” ACRONYM ANALYSIS
H……………..Hypertrophy
- R + S = 39 mm
- No evidence of Left Atrial Enlargement
- No evidence of Right Atrial Enlargement
E………………Extent of Intervals
- PR Interval……Normal
- QRS Duration = 0.12 sec
- QT interval = Normal
A………………Axis
- Lead I = Positive.
- Lead avF = Positive.
- The electrical frontal axis is therefore NORMAL.
R…………qRs-ST analysis
- Significantly wide Q-wave noted in Lead V1
- Poor R-wave progression noted
- Transition Zone between Leads V3, V4, considered normal
- ST elevation noted in Leads V1, V2, V3
T………………….T-waves
No T-wave abnormalities noted, except for those as noted in discussion below regarding the LBBB pattern.
SUMMARY OF SIGNIFICANT FINDINGS
- Voltage criteria of LVH is met; this is pseudo-LVH (remember that the criteria for LVH does not apply in the presence of the LBBB pattern).
- Duration QRS = 0.12 sec
- Q-wave and ST elevation noted.
LESSON NOTE ON THE LEFT BUNDLE BRANCH BLOCK (LBBB)
The finding of QRS = 0.12 sec should prompt you to proceed to look for the following:
1. LBBB
2. RBBB
3. IVCD (IntraVentricular Conduction Delay)
You will note that this tracing satisfies the Triad of the LBBB as follows:
1. |QRS| > or = 0.12 sec
2. RSR’ (slurred or notched) in Leads V6, V5 or V4
3. Lead I all upright with slur or notch
Now that we know that it is a LBBB, please remember the following characteristics of the LBBB pattern:
They often exhibit significant Q-waves and ST elevation in the anteroseptal leads (pseudo infarction patterns). Many times, the ST-T changes in V1, V2, V3 resemble those of an acute anteroseptal ST elevation MI. This is in fact usually not true and is a pseudo pattern (the greatest booby trap of electrocardiography).
LBBB and its T-wave characteristics
When you recognize the LBBB (as per the Triad listed above) you should then carefully look at the T-wave of EACH Lead with an awareness of the following characteristics:
LBBB with Secondary T-wave changes
If the terminal portion of the QRS complex is POSITIVE, the T-wave will be inverted (NEGATIVE).
If the terminal portion of the QRS complex is NEGATIVE, the T-wave will be upright (POSITIVE).
In this 12-lead ECG Case Study tracing you will notice that I have circled, magnified and color-coded Leads I and V5. Take note that the terminal portion of the QRS complex is positive and the T-waves are upright (positive). This is referred to as concordance of the QRS-T waves, also called primary T-wave changes. More generally described as follows:
LBBB with Primary T-wave changes
- If the terminal portion of the QRS complex is POSITIVE, the T-wave will be upright (POSITIVE)
- If the terminal portion of the QRS complex is NEGATIVE, the T-wave will be inverted (NEGATIVE)
Side Note: Please scroll up and notice that in Lead V1, the terminal portion of the QRS complex is negative and the T-wave is upright (positive). This satisfies the pattern of discordance of the QRS-T waves, also called secondary T-wave changes.
CLINICAL PEARL:
LBBB and Secondary T-waves
It is the most common finding and specifically does NOT per se suggest myocardial ischemia/infarction (old or acute).
LBBB and Primary T-waves
It is an uncommon finding and is sometimes suggestive (not diagnostic) of myocardial ischemia/infarction (old or acute).
Regarding this Case Study LBBB pattern: The T-waves of Leads I, II, V5, V6 represent Primary T’s.
CONCLUSION: LBBB with Primary T-waves possibly suggestive (not diagnostic – a diagnostic finding is given by the Sgarbossa Criteria) of myocardial ischemia/infarction (old or acute). The practitioner should diligently correlate clinically and especially compare with the old cardiogram. The Primary T-waves might be chronic.
PEARL: The LBBB pattern is the greatest booby trap of electrocardiography. When looking for the acute MI / ischemia, it is extremely difficult to recognize in the presence of the LBBB. One exception to this rule is as follows:
- In the LBBB, the presence of Primary T-waves is consistent (not diagnostic) with myocardial ischemia/infarction.
- A new onset LBBB is of concern.
- The acute STEMI can be diagnosed if the tracing meets the Criteria of Sgarbossa.
INTERPRETATION:
- 1. Left Bundle Branch Block (LBBB) criteria is met.
- 2. Primary T-wave changes are present.
- 3. In the LBBB patterns, concordance of the QRS-T waves is sometimes suggestive of myocardial ischemia/infarction.
Using HEART Mnemonic to Detect a RBBB (Right Bundle Branch Block) on ECG
As the mid-level practitioner at an urgent care center in Topeka, KS, USA you are asked to interpret the ECG below.
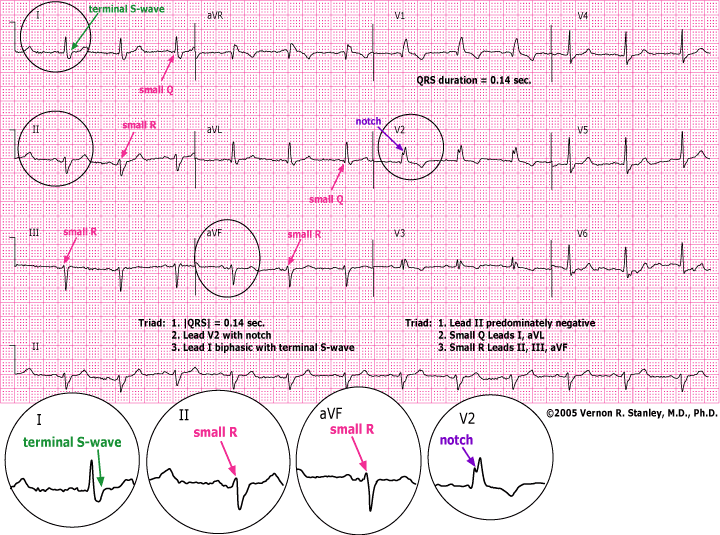
INTERPRETATION:
- Bifascicular Block consisting of the RBBB and LAFB
- ST-T wave changes are secondary to the RBBB pattern
- A predominately negative Lead II will determine that the electrical axis lies between – 30 and – 210 degrees
DISCUSSION:
The focus of this Case Study is the Bifascicular Block. We will review the classic criteria of the RBBB and LAFB.
First, let us analyze this 12-lead ECG Case Study tracing utilizing the HEART Mnemonic.
HEART Acronym Analysis
H………..Hypertrophy
- No evidence of LVH
- No evidence of Right Atrial Enlargement (RAE)
- No evidence of Left Atrial Enlargement (LAE)
E……….Extent of intervals
- PR interval———————-0.18 sec (normal)
- QT interval———————-normal
- QRS duration——————-0.14 sec (wide)
A……….Axis
- Lead I —————–dominantly positive
- Lead aVF ————-dominantly negative
- Lead II —————-dominantly negative
We conclude that the axis is more negative than –30 degrees and lies in the fourth quadrant. Furthermore, since the absolute area of Lead avF is greater than the absolute area of Lead I, we know that the axis lies between –45 degrees and –90 degrees.
R……….qRs-st analysis
- Early transition noted (frequently found in the RBBB pattern)
- ST segment down-sloping noted in Leads V1, V2 and V3
T………..T-waves
T-wave inversion noted in Leads V1, V2 and V3
LESSON NOTE ON THE BIFASCICULAR BLOCK
First let me say that the bifascicular block is a common finding and usually incidental that requires no treatment. It consists of a RBBB and an LAFB. Each of these is recognized by its triad criteria as listed below (see Stanley’s HEART Rule).
RBBB
- 1…..RSR’ (slur or notch) in Leads V1, V2 &/or V3
- 2….QRS duration = or > 0.12 sec.
- 3….Lead I biphasic QRS with broad terminal S-wave
LBBB
- 1…..RSR’ (slur or notch) Leads V6, V5 &/or V4
- 2….QRS duration = or > 0.12 sec.
- 3….Lead I all upright with slur or notch
LAFB
- 1…..Axis more negative than –45 degrees.
- 2…..Small R-waves in Leads II, III, avF
- 3…..Small Q-wave in Leads I, aVL
As you analyze each tracing in a systematic-analytical manner you will uncover by piecemeal the diagnosis of RBBB and LAFB. With this discovery you would then label the tracing as:
“there is a Bifascicular Block consisting of the RBBB and the LAFB”.
Technically speaking the Bifascicular Block could represent the following:
RBBB + LPFB (left posterior fascicular block)
Please know that the LPFB is a more uncommon finding and is recognized with less certainty on the ECG, hence for practical purposes we will focus on the LAFB only.
The treatment mode as per always requires clinical correlation, lab studies and comparison with the old cardiogram.
SUMMARY OF SIGNIFICANT FINDINGS OF THIS CASE STUDY TRACING on the RBBB
Criteria of RBBB satisfied
- 1…..|QRS| = 0.14 sec
- 2…..Lead V2 RSR’ (slur or notch) noted
- 3…..Lead I biphasic QRS with terminal S-wave
Criteria of LAFB satisfied
- 1…..QRS axis more negative than –45 degrees
- 2…..Small R-waves Leads II, III and avF
- 3…..Small Q-waves Leads I and avL
SUMMARY INTERPRETATION
Bifascicular Block consisting of
- RBBB
- LAFB
Review of Blog Questions #1-3
Q1. True or False: In the LBBB ECG pattern, concordance of the QRS-T waves is sometimes suggestive of myocardial ischemia/infarction.
- A. True
- B. False
Q2. An ECG which demonstrates a RBBB (Right Bundle Branch Block) and LAFB (Left Anterior Fascicular Block) is also commonly referred to as a _________________:
- A. Bipedal Block
- B. Bifascicular Block
- C. Trifascicular Block
- D. None of the above.
Q3. A normal QRS duration “|QRS|” is:
- A. Anything greater than 0.21 sec
- B. Between 0.12-0.20 sec
- C. Less than or equal to 0.10 sec
TT Additional recommended reading & resources:
- Finding a STEMI in the presence of the Left Bundle Branch Block (LBBB) – ECGcourse.com
- STEMI Review, Mod 2: Sgarbossa Criteria – ECGcourse.com *Premium Content
- Left Bundle Branch Block (LBBB) • LITFL • ECG Library Diagnosis
- Left bundle-branch block–pathophysiology, prognosis, and clinical management – PubMed (nih.gov)
- Right bundle branch block (RBBB): ECG, criteria, definitions, causes & treatment – Cardiovascular Education (ecgwaves.com)
Questions about this blog or any of our courses? Contact Us.
-
 BOGO: 12-lead ECG Course + 50 ECG Case Study Course (43 Hours Cat I CME/CE) | 50% Off
 -
 BOGO: 12-lead ECG Course + Animated ECG Rhythm Course (39 Hours Cat I CME/CE)
 -
 50 ECG Case Study & STEMI Review Combo Pack (19 Hrs CME)
 -
 Starter Online ECG 3-course Suite (22 Hrs CME | ACLS Prep + STEMI + 50 Cases)
 -
 Intensive Triple Bundle ECG Course Suite: (52 Hrs Cat I CME/CE)
 -
 STEMI Recognition Review Course (6 Hrs CME)
 -
 Online ACLS Rhythms Prep Course (3 Hrs CME)
 -
 50 ECG Case Studies Course (13 Hrs CME)
 -
 Animated ECG Rhythm Interpretation Course (9 Hrs CME/CE)
 -
 Advanced 12-Lead ECG Interpretation Course (30 Hrs CME)
2 Responses