(c) 2025 ECGcourse.com. All rights reserved. | Author: Vernon R Stanley, MD, PhD | Edited by Courtney Stanley, MSPA-C |
There are many approaches to reading an ECG Rhythm strip. It is important to keep in mind that there are not necessarily wrong methods to approaching the rhythm strip. Techniques and methods can be as varied as individual practitioners’ habits. But it is very important to adopt a systematic approach to each and every ECG rhythm strip you read. In this post, we provide a street-smart method by which the medical practitioner can analyze each ECG Rhythm Strip in a systematic way.
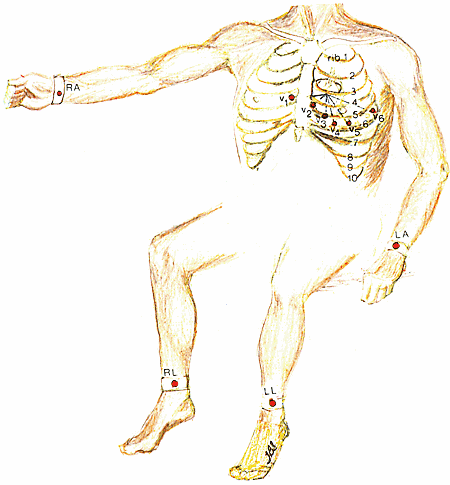
Much clinical information can be gleaned from the ECG rhythm strip, such as underlying cause of syncope, general fatigue or even anxiety symptoms to name a few. The ECG rhythm strip is recorded from the viewpoint of Lead II. Lead II is an “inferior-looking”, bipolar lead, meaning there is a positive and negative electrode. It is placed as follows on the body: the positive lead is placed on the left leg and the negative lead is placed on the right arm (1).

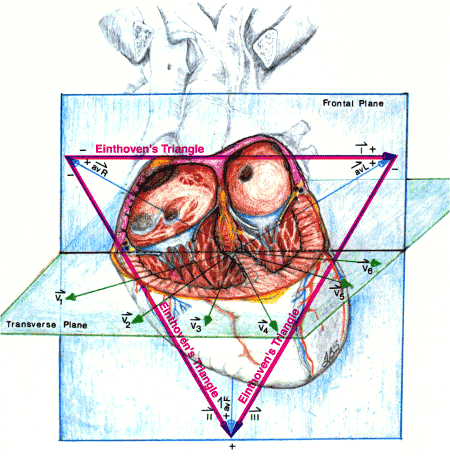
We are also reminded of the Einthoven Triangle and the role Lead II plays in forming this triangle. See this diagram below. You may also review this in detail: 12-lead ECG: Changes of Reciprocity & Einthoven’s Triangle ECGcourse.com

Our “quick” recommended checklist for reading an ECG Rhythm strip can be found here and can also be downloaded via our FREE printable. Please enjoy this form below and share!
- Is the ECG Rhythm Regular? Y/N
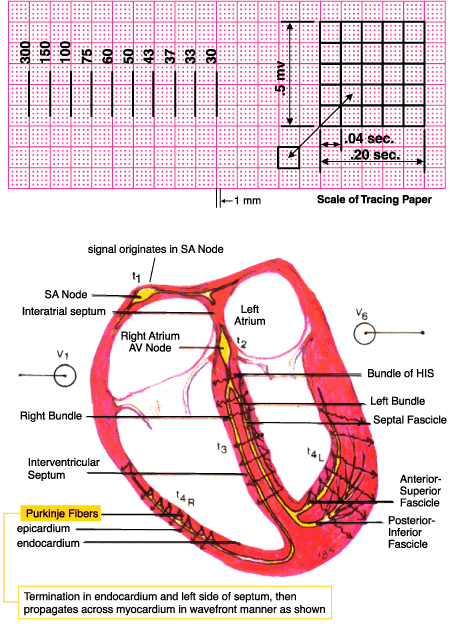
- What is the (Ventricular) Rate (determined using the scale below for QRS-QRS Interval)?
- What is the PR Interval in Seconds (Is this interval prolonged/normal/shortened | Normal is 0.12 sec to 0.20 sec):
- What is the QRS Duration in Seconds (Normal < 0.10 sec)?
- What is the QT Interval (Normal is less than 1/2 R-R)?
To read and interpret an Abnormal ECG Rhythm, we must understand the parameters of a Normal ECG Rhythm.
Propagation of the electrical signal of the ECG Rhythm
Before discussing recognition of the different ECG Rhythms, it is important to correlate the anatomical region where the electrical signal is generated with the electrical signal generated on the ECG rhythm strip.
In a normal, healthy heart, the electrical signal initiates in the SA (sinoatrial) node, depolarizes the Atrial myocardium, depolarizes the AV (atrioventricular) node, propagates through the Bundle of HIS, and terminates in the Purkinje cells, depolarizes the Ventricular Myocardium (endocardium to the epicardium). The myocardial tissues then recharge (repolarize) and the SA node discharges again; the cycle then repeats itself.

Where:
- 1 = time at depolarization of SA node
- 2 = time at depolarization of AV node
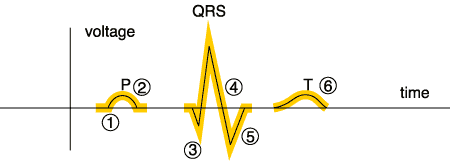
The resultant electrical signal on the ECG Rhythm is as follows (2):

- P = Depolarization of the Atria
- QRS = Depolarization of the Ventricles
- T = Repolarization of the Ventricles
Important Note: The depolarization of the SA node (at 1) and the AV node (at 2) produce only a tiny voltage and will not be visible on the standard rhythm strip.
The Normal Sinus ECG Rhythm animated rhythm can be viewed here below. Here the resultant ECG rhythm strip is color coordinated with the electrical activity in the heart. This animated is a sample taken from Dr Stanleys Animated ECG Rhythm Course (9 hours Cat I CME).
Electrical characteristics of myocardial (heart) tissues
It is essential that you understand the electrical characteristics of the heart tissues. This will aid you in understanding the normal ECG rhythm characteristics as well as the common ECG dysrhythmias that you will encounter in your practice.
The heart is composed of two basic tissue types:
- Tissue #1. The myocardium (muscle).
- Tissue #2. The special electrical conduction system*.
Electrically speaking, the two tissue types are characterized as follows below:
Tissue 1. The myocardium does not possess automaticity and subsequently will not depolarize until stimulated by an external stimulus. This stimulus is usually the adjacent Purkinje Cell or an adjacent myocardial cell in the active process of depolarizing.
Tissue 2. The special electrical conduction system has two important unique properties:
- a) It possesses automaticity, i.e., it will spontaneously depolarize and repolarize without an external
stimulus. - b) It conducts the electrical signal very rapidly as compared to other tissues.
Tissues with Automaticity include:
- SA Node, aka SinoAtrial Node (60-100 bpm)
- Internodal Pathway (Atria; 60-80 bpm)
- AV Junction Node (40-60 bpm)
- Bundle of HIS (& all branches; 40-60 bpm)
- Purkinje Cells (20-40 bpm)
Important properties of Automaticity Tissues:
The automaticity tissue of the heart is designed to provide an automatic electrical stimulus to ultimately depolarize the myocardial tissue. The system is designed with a built-in demand backup as its fail-safe mechanism. The design function is as follows:
- If normal Sino-Atrial Node function…
SA Node discharges at a rate of 60-100 bpm. This signal will suppress all the other automaticity tissues. - If the SA Node fails…
The next in line automaticity tissue takes over as follows:
Atrial Internodal Pathways- discharge rate 60 – 80 bpm. (This signal will suppress all the lower hierarchy automaticity tissues.) - If the Atrial Tissue fails…
The next in line automaticity tissue takes over as follows:
Junctional (including Bundle of HIS and branches) – discharge rate 40-60 bpm. (This signal will suppress all the lower hierarchy automaticity tissues) - If the Junctional Tissue fails…
The next in line automaticity tissue takes over as follows:
Terminal Purkinje Fibers – discharge rate 20-40 bpm. - If the Purkinje Fibers fail…
Ventricle myocardium will receive no electrical signal. Flatline will follow, then death.
For more detailed covered of how to read an ECG rhythm strip, please consider our Animated ECG Rhythm Course (9 hours Cat I CME). It is a great way to review 26 of the most common ECG rhythms encountered in the practice of medicine. And it’s a fantastic board preparation or pre ACLS preparation course.
References & Additional Reading:
- CV Physiology | Electrocardiogram Standard Limb Leads (Bipolar)
- How to Read an EKG Strip in 5 Steps – CardiacDirect
- EKG Interpretation Cheat Sheet: Understanding the Basics | Nexus Nursing Institute
- FREE Quizzes & Printables from Dr. Stanley’s ECG Courses & ECGcourse.com
New arrivals
-
50 ECG Case Study Packet | Textbook, Workbook, HEART Ruler + 13 Hours Cat I CME
$273.49Original price was: $273.49.$240.49Current price is: $240.49. -
BOGO: 12-lead ECG Course + 50 ECG Case Study Course (43 Hours Cat I CME/CE) | 50% Off
$644.00Original price was: $644.00.$571.50Current price is: $571.50. -
BOGO: 12-lead ECG Course + Animated ECG Rhythm Course (39 Hours Cat I CME/CE)
$624.00Original price was: $624.00.$561.50Current price is: $561.50. -
Unisex HEART Mnemonic Long Sleeve Black T-shirt
$39.50Original price was: $39.50.$34.00Current price is: $34.00.


