(C) 2023 All rights reserved. ECGcourse.com LLC | Author: Vernon R Stanley, MD, PhD | Editor: Courtney Stanley, PA-C
Before proceeding to this blog, we invite you to answer the following questions. (Answers may be found at the bottom of this blog post.)
Q1. A 42-year-old male presents to the clinic with an ECG demonstrating ST-elevations in II, III & avF & ST-depressions in leads V1, V2 & V3. This pattern most likely represents:
- A. A Normal Variant
- B. ST-depression of Reciprocity & ST-elevation of an Acute MI
- C. A pseudo pattern sometimes found in 42 year old men
- D. None of the Above
Q2. In the case of an Acute Antero-lateral MI (STEMI), the associated leads would be __________________ and the reciprocal leads would be _______________________.
- A. Leads II, III & avF | Leads V2, V3, V4, V5, V6, I & avL
- B. Leads avR & avF | Leads V1 & I
- C. Leads V2, V3, V4, V5, V6, I & avL | Leads II, III & avF
In the discussion of ECG interpretation, we often hear the term Einthoven’s Triangle. Technically, Einthoven’s Triangle references the imaginary triangle formed by the limb leads (all bipolar leads): Lead I, Lead II, & Lead III. It was first theorized by Willem Einthoven (b 1860), the inventor of the ECG. A schematic of Einthoven’s Triangle is illustrated below and highlighted in pink. But from where did this term originate? We explore Dr Willem Einthoven – who he was and what he contributed to the field of medicine as well as its significance when discussing interpretation of the 12-lead ECG.
Who was Willem Einthoven?
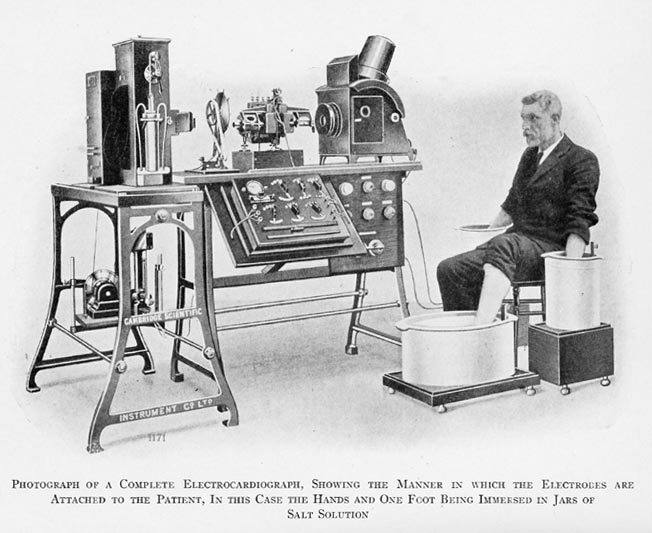
A Dutch physician & physiologist born on September 29th, 1860, Willem Einthoven was the son of a Dutch physician. He began his work on the ECG machine in 1901 with prototypes of a string galvanometer. Early ECG machines required 5 personnel to operate and weighed around 270 kilograms (around 600 pounds; read more). He is credited with our current designated labels on the ECG of P-wave, QRS complex and T-wave. Einthoven won the Nobel Peace Prize (1924) for his invention of the first practical application of the electrocardiogram (ECG) machine. Before his death in 1927, Dr. Einthoven began studio of the acoustic sounds of the heartbeat.
Clinical Application of Dr Einthoven’s Work: ECG Labels & Reciprocity
As previously mentioned, Dr. Willem Einthoven is credited with our current labeling system of the 12-lead ECG & ECG rhythm waveform as follows: P-QRS-T. This ECG labeling is demonstrated in the illustration below.
(C) 2023 ECGcourse.com LLC | All rights reserved
From the illustration above, the ECG labels represent the following:
- P1 = the start of the P-wave; SA (sinoatrial) node electrical signal begins
- P2 = the end of the P-wave
- QRS3-5 = the depolarization of the ventricles
- T6 = the repolarization of the ventricles
Now, please reference the following chart and diagram which delineates the standard block counting notation for counting the rate on the ECG Paper Strip.
Please utilize the following video with optional audio file below. For best viewing change to the 1080p setting using the gear icon on the lower right corner of the video file below.
Optional Audio File: Normal Sinus ECG Rhythm (click below; may be played at same time as video)
Video Animation Clip of Normal Rhythm on ECG: *Note – Audio file separate above. For best viewing of this video, click the gear in the bottom right corner and move “Quality” settings to 1080p.
Einthoven’s Triangle & the Concept of Reciprocity on the ECG
Einthoven’s Triangle is defined as the imaginary triangle comprised by 3 limb leads as follows: Lead I, Lead II, Lead III. Along with the augmented leads (avR, avL, avF), these 6 make up the Hexaxial system (read more). Please reference this ECG Illustration below.
Illustration 1. Einthoven’s Triangle and the Hexaxial Vector System and Precordial Vectors.
You will note that no two vector pairs are exactly 180° in spatial rotation, therefore there are no pairs that satisfy the criteria of being labeled as reciprocal pairs. When we do refer to reciprocal leads, we do so loosely and are saying they are reciprocal-like pairs. It is of interest to note that there are pairs that approach 180° apart — the following pairs are 150° out of phase as follows:
- Lead avR and Lead I
- Lead avR and Lead II
- Lead avL and Lead III
From this you can surmise that these ECG Lead pairs will often exhibit reciprocity-like properties. But can you surmise these pairs will exhibit exact reciprocity features on the ECG? No!
For example, if Lead avR demonstrates STE (ST elevation), Lead I and maybe Lead II will often demonstrate STD (ST depression), i.e. they have mirror image tendencies.
It is a curiosity that you can demonstrate this reciprocal image by placing a small pocket mirror perpendicular to the paper and observe the P-QRS-ST-T reciprocal image in the mirror on the ECG Lead.
Armed with this mentality, I pose the question:
Where would I place a lead to demonstrate 180°reciprocity? ANSWER:
As you brainstorm this question, consider each vector lead →→then rotate it 180° →→ and place an electrode at that location. Take note that this will require that you add a special electrode to accommodate your need.
For example…
Consider Lead V1. This is represented by a vector radiating from the chest at the right 4th intercostal space at the right parasternal border and in the transverse plane.
If you rotate this vector 180°, it will exit the chest posterior at the position of V7, V8, V9 (V8 is at the 5th ICS (InterCostal Space level at the tip of the scapula). These mental gymnastics will aid you in your dissection of the ECG especially when adding special ECG Leads such as V7, V8, V9, V4R and so forth.
So why does all this matter you ask?
The Concept of Reciprocity
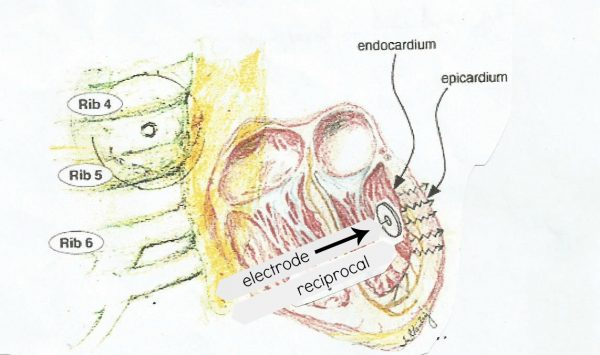
The wavefront of the myocardium illustration above is propagating away from the electrode (reciprocal), and you would predict the following P-QRS-ST-T complex (this represents the mirror image of the wave complexes of Illustration 4):
This simple phenomena seen above is referred to as the principle of reciprocity and it basically says:
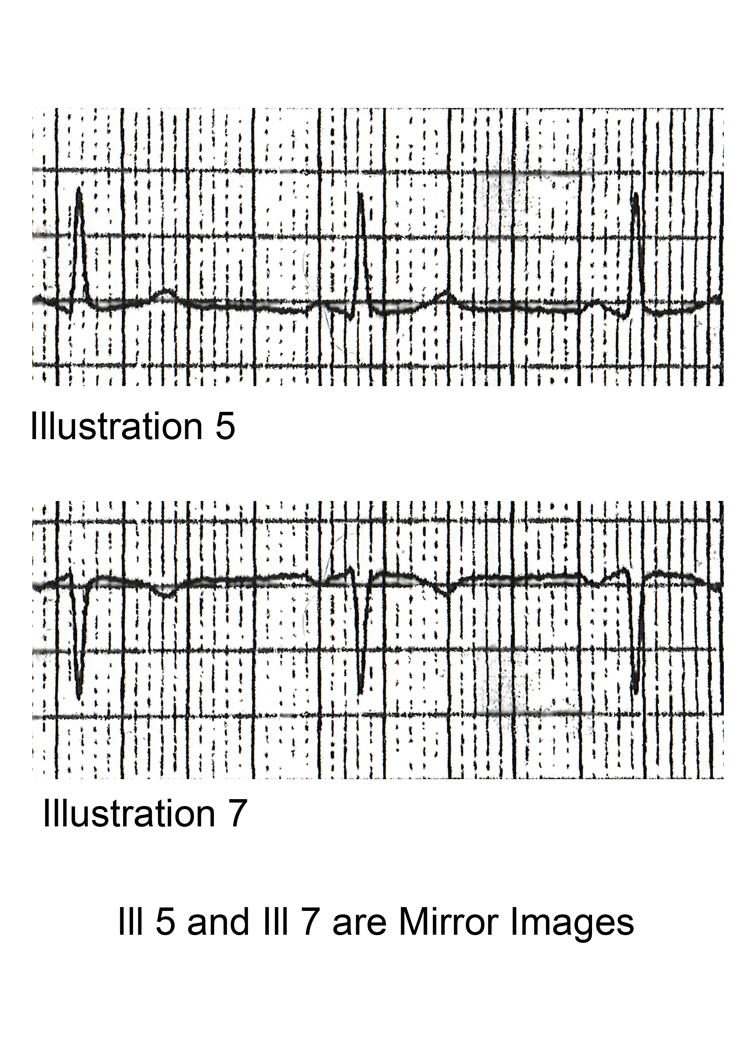
If a voltage deflection measured by a given electrode is + [positive] →→→→→→ the voltage deflection measured by its electrode (reciprocal) will be – [negative].
If a voltage deflection measured by a given electrode is − [negative] →→→→→ the voltage deflection measured by its electrode (reciprocal) will be + [positive].
Please be aware that this conclusion also holds for the voltage of ST segments and T-wave deflections. For example, in a given complex, if ST Elevation (STE) is present, then the reciprocal Lead will demonstrate ST Depression (STD) and vice versa.
Regarding the T-wave, if the T-wave is upright in a given electrode →→→→ the reciprocal electrode will demonstrate an inverted T-wave. See Illustration 8 below.
SUMMARY ILLUSTRATION
Implicit in this Illustration is that the two vectors of reciprocity are exactly 180° in spatial rotation and that the electrodes are placed on the endocardium-epicardium surface.
In the clinical world, this of course is not the case because we place the electrodes on the outer skin surface and soft tissues (skin, adipose tissue, lung, vasculature, interstitial tissues) separate the electrode from the heart tissue and will distort and attenuate the signal.
That said, our approach will serve its purpose. It will give us insight into the electrical phenomena as we predict or analyze a given P -QRS-ST-T complex. The principle of reciprocity for interpretation of the 12-lead ECG will be added to our tool bag as we brainstorm and analyze our findings. It is another stabilizing factor during our mental gymnastics.
Our challenge is many-fold when evaluating the ACS (Acute Coronary Syndrome) patient:
- As we uncover abnormalities on the ECG we ask: Is this a STEMI?
- The converse is also true as follows: if the ECG is a STEMI (posterior, anterior, lateral, highlateral, inferior) what should we observe on the 12-lead ECG?
- Do we need to add additional Leads to the standard 12-lead ECG such V7, V8, V9, V4R?
Q1. A 42-year-old male presents to the clinic with an ECG demonstrating ST-elevations in II, III & avF & ST-depressions in leads V1, V2 & V3. This pattern most likely represents:
- A. A Normal Variant
- B. ST-depression of Reciprocity & ST-elevation of an Acute MI
- C. A pseudo pattern sometimes found in 42 year old men
- D. None of the Above
Q2. In the case of an Acute Antero-lateral MI (STEMI), the associated leads would be __________________ and the reciprocal leads would be _______________________.
- A. Leads II, III & avF | Leads V2, V3, V4, V5, V6, I & avL
- B. Leads avR & avF | Leads V1 & I
- C. Leads V2, V3, V4, V5, V6, I & avL | Leads II, III & avF
-
Advanced 12-Lead ECG Interpretation Course (30 Hrs CME)
$499.00 -
50 ECG Case Studies Course (13 Hrs CME)
$145.00 -

Animated ECG Rhythm Interpretation Course (9 Hrs CME/CE)
$125.00 -
STEMI Recognition Review Course (6 Hrs CME)
$90.00 -
Intensive Triple Bundle ECG Course Suite: (52 Hrs Cat I CME/CE)
Original price was: $769.00.$699.00Current price is: $699.00. -
ECG Rhythms Field Guide Book
$48.50 -
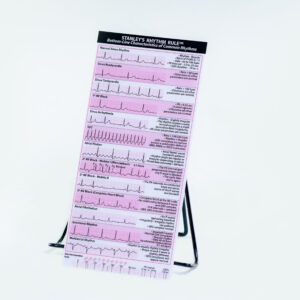
ECG Rhythm Ruler Pocket Guide
$14.00 -
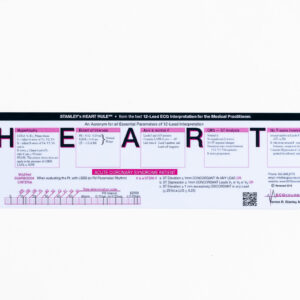
HEART Ruler Mnemonic Pocket Guide Cheat Sheet
$14.00 -
Online ACLS Rhythms Prep Course (3 Hrs CME)
Original price was: $65.00.$49.00Current price is: $49.00.

2 Responses