(C) 2022 ECGcourse.com LLC. All rights reserved. | Author, Vernon R Stanley, MD, PhD | Editor, Courtney Stanley, MS, PA-C
We have previously discussed two of the greatest boobytraps of interpreting the 12-lead ECG: the LBBB (Left Bundle Branch Block) and LVH (Left Ventricular Hypertrophy). In this challenge, we will focus on the distortions created by the Left Ventricular Hypertrophy (LVH) pattern.
Please answer the following Q&A regarding the LVH Pattern: Common distortions to the 12-lead ECG, secondary to LVH (Left Ventricular Hypertrophy), may include (answer at bottom of post):
A. ST-T Changes (also known as “strain”)
B. T-wave Inversion
C. Significant Q-waves
D. ST elevation
E. Delta Waves
F. All of the Above
G. A, B, C & D Only
An introductory discussion regarding Left Ventricular Hypertrophy (LVH)
It is important that the provider be aware of the reason for the necessity of developing a familiarity with hypertrophy. For practical purposes, we will focus on left ventricular hypertrophy in this discussion, because it is absolutely essential that this pattern be recognized.
The reason for the necessity to know the criteria for LVH is at least two-fold:
- It is an extremely common finding; therefore the provider must recognize it readily.
- The pattern of LVH will often distort the ECG waveshape such that it may mimic changes of an acute MI, old MI or Ischemia.
Therefore, as we progress to look for ischemia or acute/old MI, we must take into account whether the patient has evidence of LVH or not.
First, let us define hypertrophy as defined by Dorland’s Medical Dictionary:
Hypertrophy: The morbid enlargement or overgrowth of an organ or part due to an increase in size of its constituent cells.
The provider should be aware that a common cause of LVH is long-standing hypertension and primary cardiac disease such as valvular disease. Either of these would place a chronic workload on the left ventricle, and the ventricle will hypertrophy to compensate for the extra workload.
The question simplifies to “What do we see on the electrocardiogram if the patient has LVH?”. There are many different lists of criteria in the literature for the diagnosis of LVH (Left Ventricular Hypertrophy) but they all have two things in common:
- They are indeed quite specific: if LVH is present on the ECG, the patient most likely has the condition.
- They are not very sensitive: many people who actually have LVH, do not have ECGs which reveal it.
The meaning of item #1 and #2 above is that if a group of patients are known to have LVH, significant numbers of their ECGs will NOT show LVH by our electrocardiographic criteria. On the other hand, if the ECG meets the criteria of LVH, then the patient most likely will indeed have LVH (This could ultimately be proven by echocardiogram, cardiac catheterization, MRI or autopsy).
Since the left ventricle myocardium is thickened in LVH it seems logical to suspect that:
- The voltage amplitude contribution from the left ventricle would be larger than normal.
- QRS might be slightly prolonged.
- There might be a slight left axis shift.
By far the most significant factor of the above three is that of number “1”, i.e. the VOLTAGE is enlarged. The diagnosis is centered on analysis of leads that “look” at the left ventricle, i.e. leads V1, V2, V3, V4, V5, V6 and of course limb Leads I and avL (lateral and high lateral leads).
As a compromise to the multitude of listings for the criteria of LVH, we will agree to the following list:
- S (Max Voltage of Lead V1, V2, V3) + R (Max Voltage of Lead V4, V5, V6) > 35 mm
OR
2. R voltage of Lead avL > 12 mm
OR
3. R-wave voltage of S-wave voltage > 20 mm in any Limb Lead (I, II, III, avR, avL, avF)
OR
4. R-wave voltage or S-wave voltage > 25 mm in any precordial lead (V1, V2, V3, V4, V5, V6)
NOTE: It is important that the student be aware that the QRS voltage varies with age. More specifically, the voltage is greater in the younger individual and will be smaller for the older individual. As an approximate rule of thumb, age 35 can be used as a cutoff point, i.e. if the patient is 35 years or older, the above four criteria are valid.
If the patient is younger than 35, the criteria are less reliable and in fact it is wise to avoid making the diagnosis of LVH if the patient is younger than 35 years. If the diagnosis is suggested by the electrocardiogram, then it should be qualified with such statements as follows: “The ECG meets voltage criteria for LVH but may be normal for stated age.”
The point is, that the criteria of LVH depends on the age of the patient and if the patient is very young, the criteria are no longer valid.
It is also important that the provider be aware that the QRS voltage will be less if the patient has lung disease (i.e. COPD, emphysema, pneumoconiosis, silicosis).
Those variables which cause a modification of the voltages will clearly affect the sensitivity and specificity of the criteria of LVH.
STEMI Mimic Changes to the ECG Secondary to LVH (Left Ventricular Hypertrophy)
The criteria of LVH have been previously discussed in the past slide. These criteria reflect the measurement of the voltage of the R of S-wave in certain leads. Also, the age must be greater than 35 years.
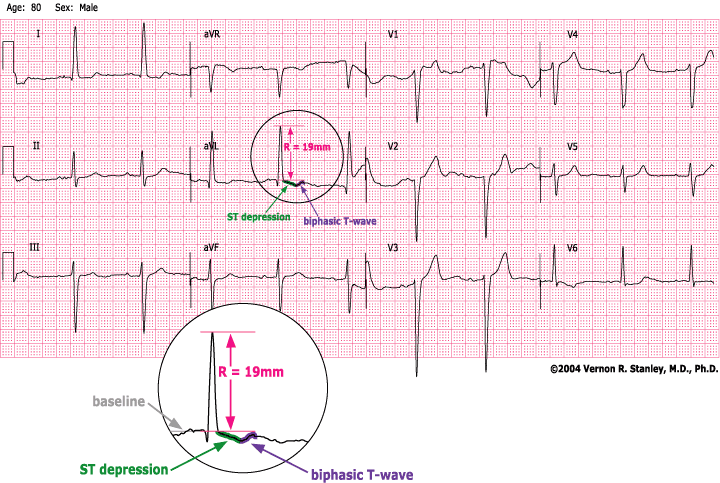
It is important to take note that another common characteristic of LVH will often (but certainly not always) appear in the lateral-highlateral leads (V4, V5, V6, I, avL). This is best shown by example in the tracing below. You will notice that the ECG certainly satisfies the criterion for LVH (R+S > 35 mm). In addition, the student should take note that there is ST-segment depression and T-wave inversion in some of the lateral leads. You should also note that the ST-segment depression assumes a characteristic ramp-like depression and the T-wave inversion is asymmetrical, ie. is not reproduced by rotation around the rotational axis. This is clearly an important observation since this is now added to our differential explanation for ST-segment depression (along with ischemia, acute infarction and reciprocity) and T-wave inversion (along with ischemia, LBBB, RBBB, IVCD). This pattern is called LVH with ST-T repolarization changes (sometimes referred to as “strain pattern”).
It is also interesting to note that the LVH pattern will often produce Q-waves in V1 and V2 and event V3. These Q-waves do not represent an old MI but in fact might be simply a part and parcel of the LVH with strain pattern. This pattern invariably represents a long-standing pattern of many months to years.
The provider should also observe that the LVH pattern is often associated with poor R-wave progression and late transition.
Furthermore, one commonly sees ST-segment elevations in Leads V1, V2 and maybe V3. These ST-segment elevations may be “CONCAVE DOWN” as a part and parcel of the LVH pattern. Since this does not represent an acute MI pattern necessarily, it is sometimes referred to as a “PSEUDOINFARCTION PATTERN” in Leads V1, V2, V3.
LVH Example tracing
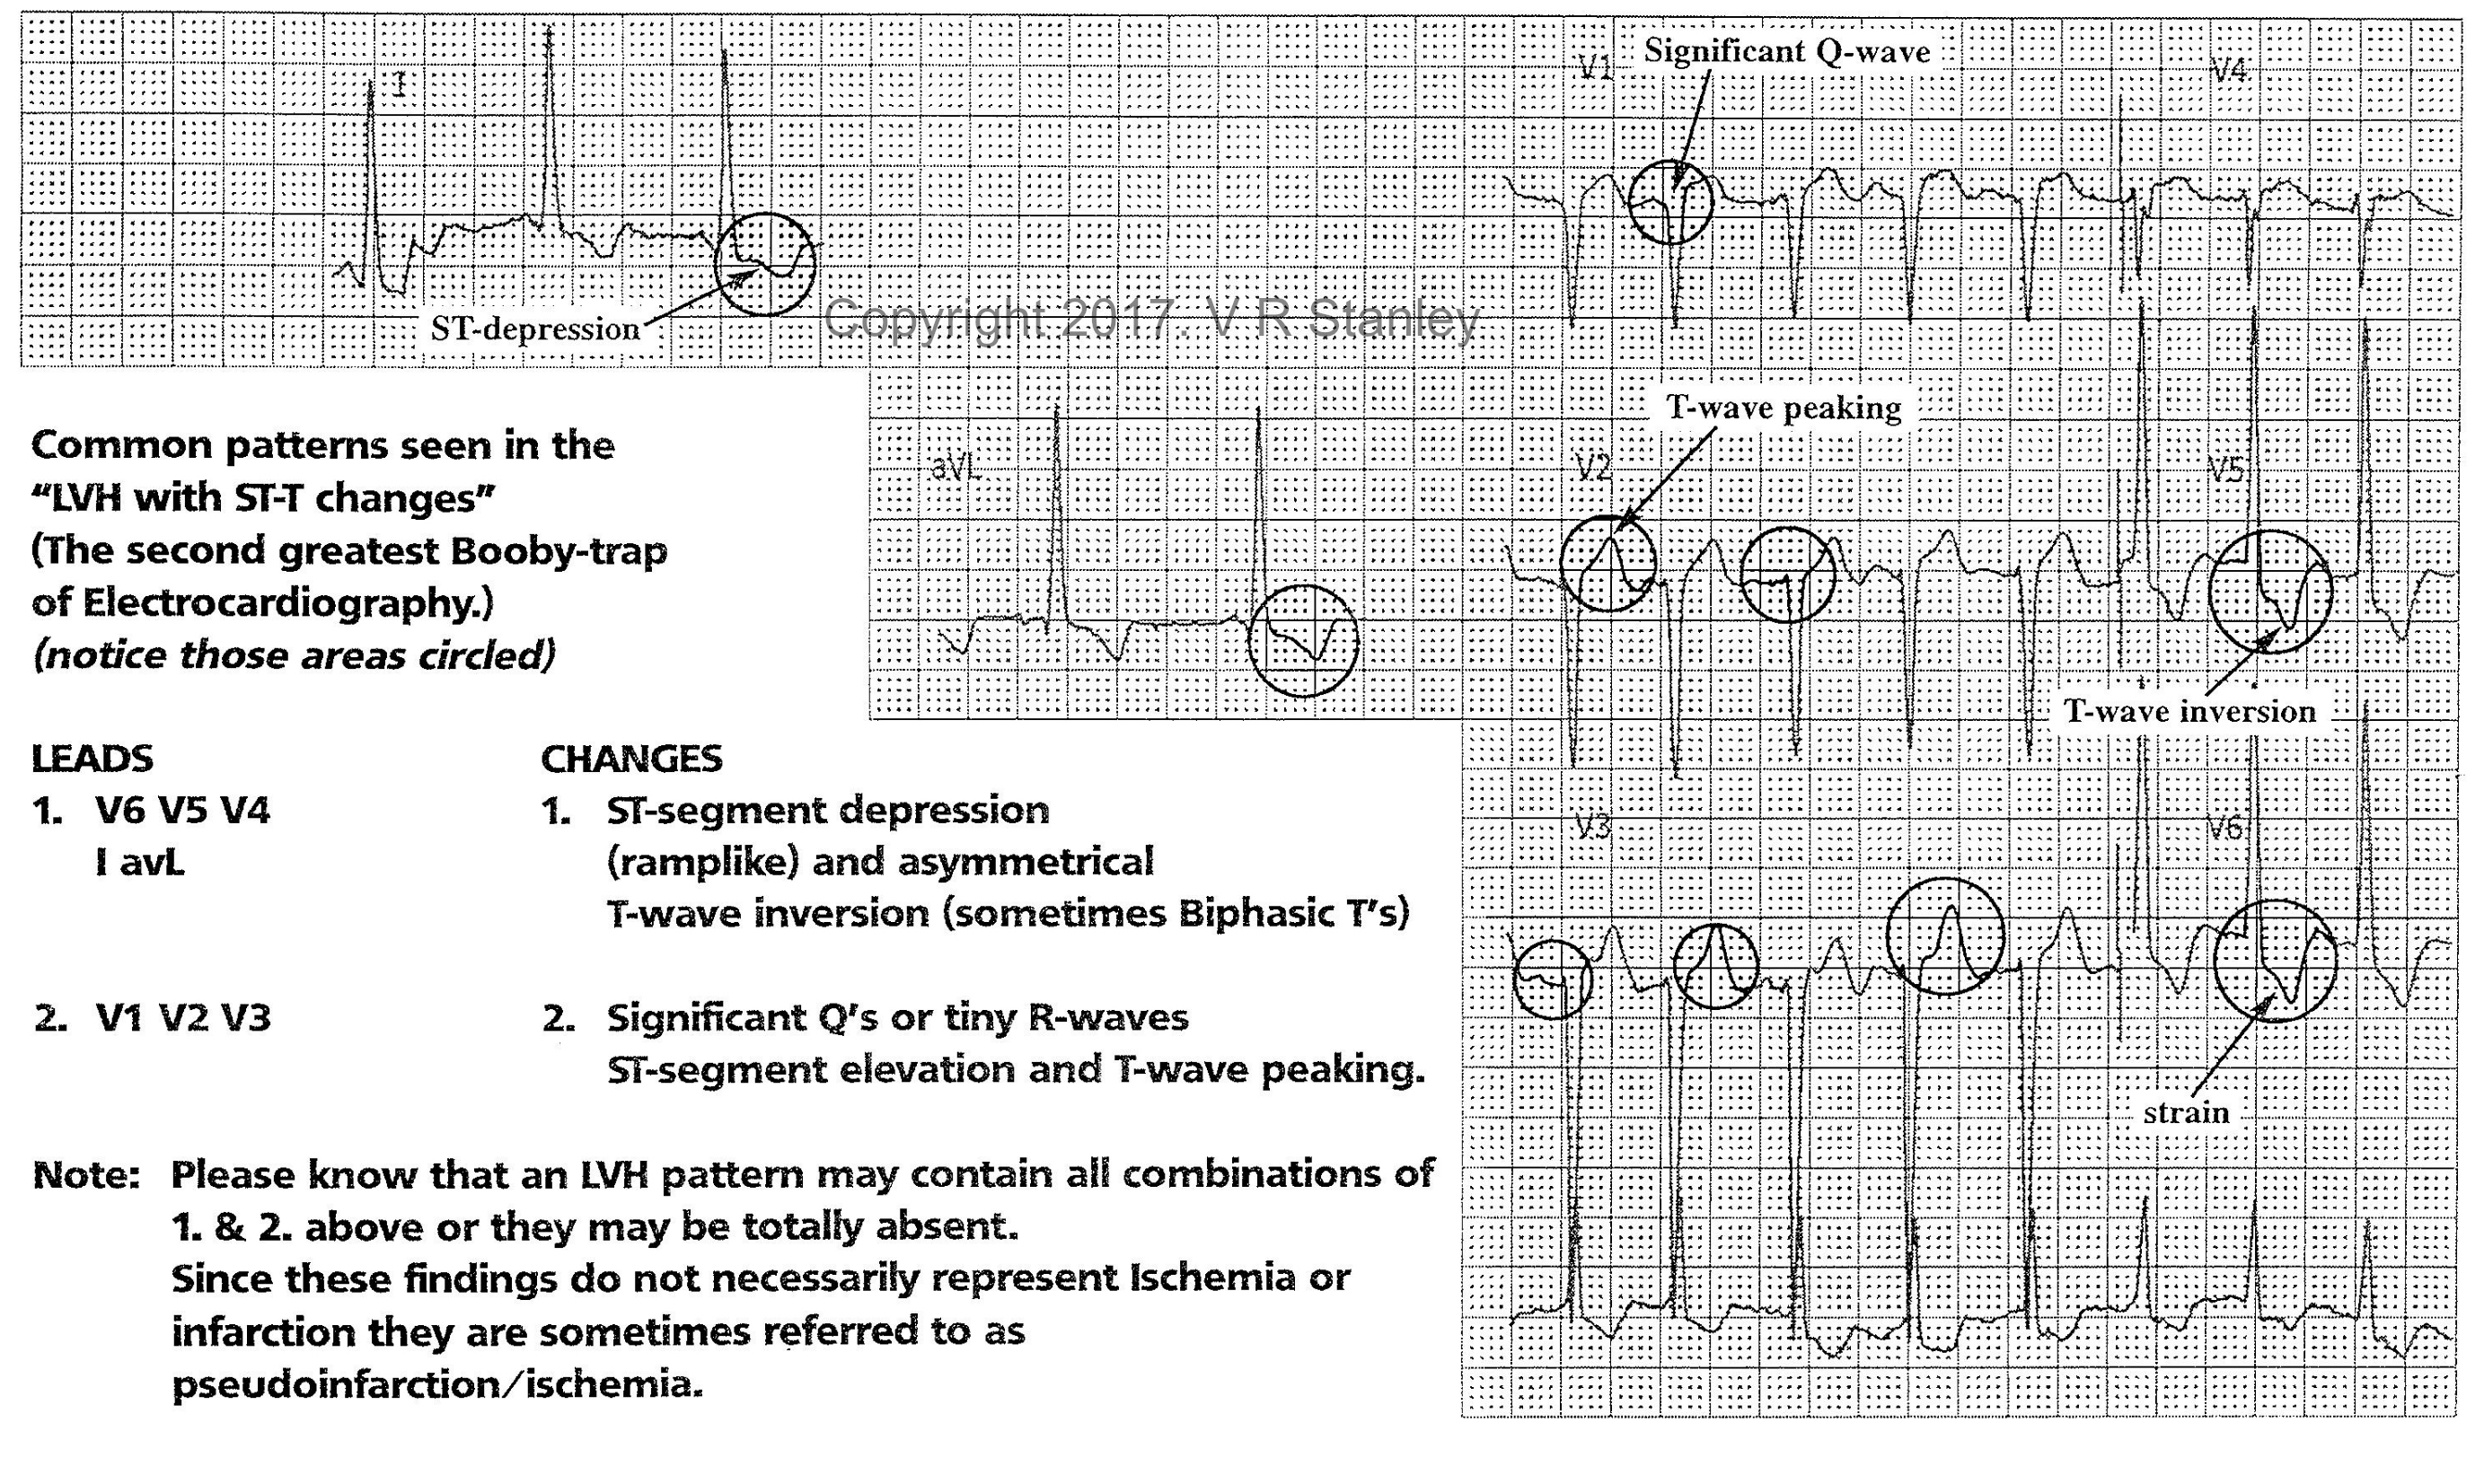
To summarize, it is important to be aware that LVH pattern may demonstrate:
- Pseudoinfarction ST-elevation with ST elevation that is CONCAVE Down and peaked Ts (in leads V1, V2, V3)
- Pseudoinfarction Q-waves, often present in V1, V2, V3
- ST depression and/or T-wave inversion in the lateral-highlateral leads of strain (V6, V5, V4, I, avL)
QUESTION: Common distortions to the 12-lead ECG, secondary to LVH (Left Ventricular Hypertrophy), may include:
A. ST-T Changes (also known as “strain”)
B. T-wave Inversion
C. Significant Q-waves
D. ST Elevation
E. Delta Waves
F. All of the Above
ANSWER: G. A, B, C, D Only


1 Response