(C) Renewed 2024 ECGcourse.com LLC | Author Vernon R Stanley, MD PhD | Courtney Stanley, PA-C Co-editor | All rights reserved. Please note content is not legal advice and is not a comprehensive or complete discussion of this topic.
Question: The presence of Early R-wave Transition (R-wave > S-wave between Leads V1 & V2) may indicate which of the following (answer at bottom of post):
A. Normal Variant
B. RBBB
C. Posterior Infarction
D. All of the Above
E. None of the Above
As you traverse the precordium sampling the voltage (see Pg. 4 of Dr Stanley’s Tracings Manual) V1 V2 V3 V4 V5 V6 you will notice that the R-wave gets taller and taller and taller (crescendos) then peaks (note Lead V5 ) and then declines (decrescendos). You will find this peculiar characteristic in all NORMAL ECG’s and it is called R-Wave Progression. If this characteristic of R-wave crescendo — decrescendo does not hold true, but in fact the R-Wave progression is flat, we denote this as Poor R-Wave Progression.
V trans = Hypothetical point on chest where R=S.
Pearl: In the NORMAL ECG, the Transition Zone will occur in the following range: V2 V3 V4 (inclusive). If it occurs earlier, it is called EARLY TRANSITION (Early R-wave Transition). If it occurs later, it is called LATE TRANSITION.
Please study the Illustration below with a focus on the hypothetical Lead Vtrans It is highlighted in yellow and represents the TRANSITION ZONE LEAD. This indicates the location as you traverse the precordium where the equality R = S occurs. Please reference this diagram below.
Electrode V trans = Hypothetical lead where R = S.
The bottom-line point of the above illustration is as follows:
- Normal (R-wave) Transition……………..Vtrans occurs between Leads V3 and V4 (within the range of V2 V3 V4)
- Early (R-wave) Transition …………..Vtrans occurs between Leads V1 and V2 (earlier than the range of V2 V3 V4 )
- Late (R-wave) Transition ………… Vtrans occurs between Leads V5 and V6 (later than the range of V2 V3 V4 )
The significance of transition zone?
Notice that R > S in Lead V2. Since this transition occurs earlier than is normal (transition between Leads V2 – V4 is considered “normal”) it is best described as EARLY TRANSITION or Early R-wave Transition. The finding of early R-wave transition is most often a normal variant or associated with the RBBB but please know that it might also be found in the Posterior Infarction (either acute or old).
There are no Leads of the standard 12-lead ECG that most accurately monitor the right ventricle (RV) or the Posterior LV. Therefore you must add special leads that do so.
It is no trite statement to say:
If you do not look for the “Posterior STEMI” or the “RV STEMI”, you will never find one.
This search involves the placement of extra leads as listed below:
| Infarcted Area | Special Leads |
| RV STEMI | V4R |
| Posterior STEMI | V7, V8, V9 |
PEARL:
The Acute Inferior STEMI (ST Elevation MI) is frequently associated with the Right Ventricular STEMI and the Posterior STEMI. You will be looking for ST-segment elevation concave down in the special leads V4R, V7, V8, V9.
POSTERIOR INFARCTION
The posterior aspect of the heart will of course be subject to ischemia and infarction (acute and old) as is any other area of the heart. The status of the posterior aspect is determined by analyzing the lead(s) that “looks at” the posterior aspect of the heart. As has been stated earlier, no lead of the standard 12-lead ECG looks directly at the posterior aspect of the heart. We must therefore rely on indirect measurements and consequently the information is of limited value.
As in the case of the right ventricular infarction, the posterior infarction is frequently associated with the Acute Inferior Infarction. The clinical meaning is simply that in the setting of an acute inferior MI, you should “think” acute posterior infarction and proceed to look for it.
You will certainly agree that the monitor leads V1 and V2 indirectly view the posterior aspect of the heart. It should be no surprise to suggest that we look for ST-depression in leads V1 and V2 (instead of the ST-elevations) as an indicator of acute infarction. Figure D-1.
This transformation of ST-depressions to ST-elevations can be appreciated by holding a mirror to the tracing as shown in Figure D-2. It is also important to realize that if the posterior aspect is injured, its voltage contribution will be lowered. Therefore from the vantage point of the anterior chest, the R-wave will heighten (since the anterior depolarization vector is opposed by the posterior depolarization vector). It then seems logical to predict a “larger than usual” R-wave in leads V1 and V2 in the case of the acute posterior infarction.
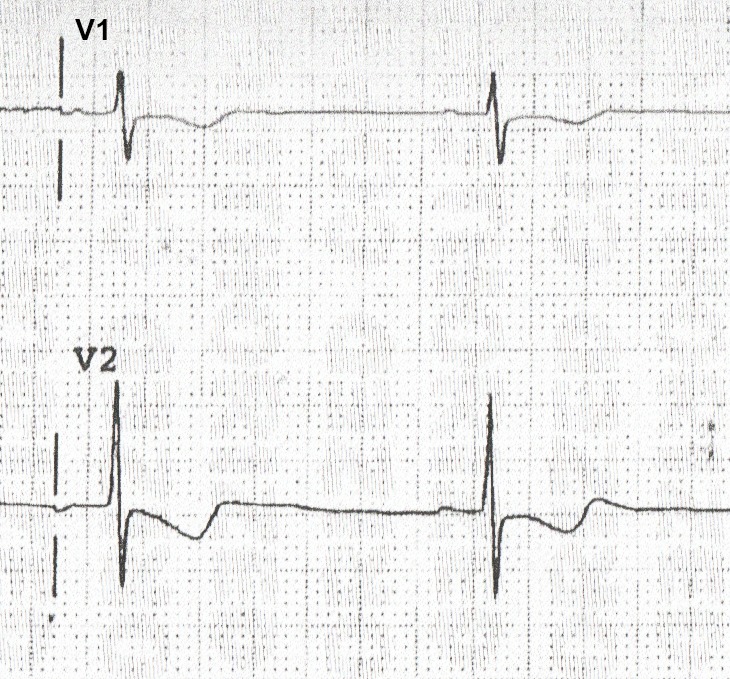
FIGURE D-1 ST-Depression in Leads V1 and V2
A direct monitor of the posterior aspect is reflected in lead Vposterior as shown in Figure D-3 by placing special electrodes on the patient’s back.
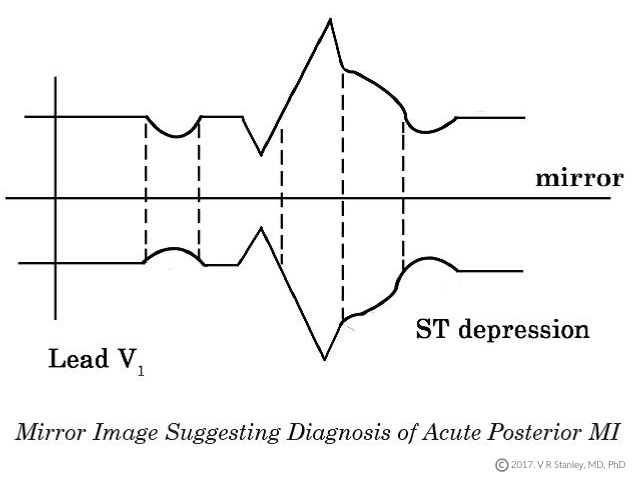
FIGURE D-2 Mirror Image Suggesting Diagnosis of Acute Posterior MI
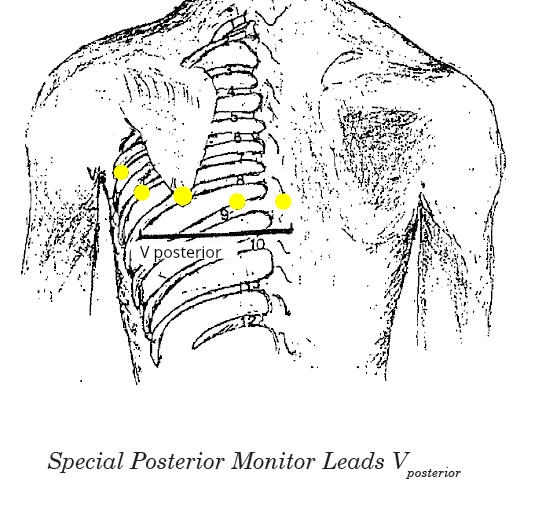
FIGURE D-3. Special Posterior Monitor Leads Vposterior
The standard 12-lead ECG does not contain leads Vposterior but the leads could certainly be placed on the patient. If we are looking for evidence of an acute posterior MI or ischemia, then we as per usual look for ST-elevations and/or T-wave inversions in leads Vposterior.
RIGHT VENTRICULAR INFARCT
In order to monitor the right ventricle, one must place special leads on the chest: The right precordial leads V1R, V2R, V3R, V4R, V5R, V6R. This is shown in Figure D-4 below
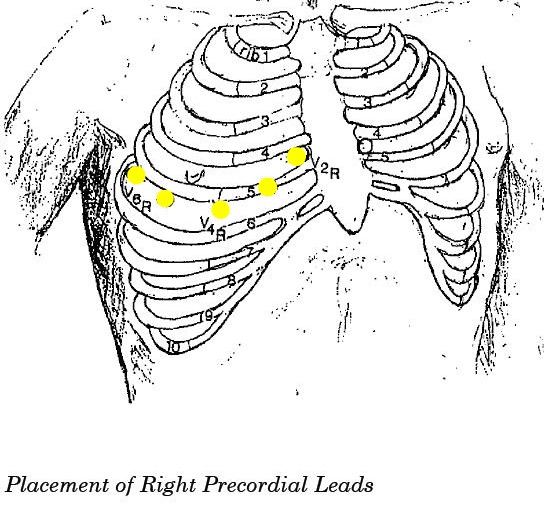
Figure D-4. Placement of Right Precordial Leads
If one looks at the right precordial leads of the normal heart (non-acute MI) you will note a finding similar to the tracing attached. (Tracing D-1).
ACUTE POSTERIOR MI (THE HIDDEN-PICTURE STEMI)
Returning to the ACS patient I will pose the question: What changes would you expect to see on the 12-Lead ECG in the posterior STEMI?
ANSWER:
I would expect to see STE in those leads that “look at” the posterior aspect of the heart. But alas, NONE of the leads of the standard 12-Lead directly monitor the posterior aspect of the heart; however we can place special electrodes on the chest that do. Specifically the leads V7, V8, V9 are monitors of the posterior aspect of the heart. We know that from our previous discussion that if the cardiogram demonstrates STD in V1, that the reciprocal leads V7, V8, V9 will demonstrate STE. We therefore conclude that the POSTERIOR STEMI is presesnt if Leads V7, V8, V9 show STE.
Please look at the artist’s rendering in Illustration 12 of the vectors especially V7, V8, V9, V1, V2, V3 with their associated ST Elevation or ST Depression respectively.

Please note that I have included a QRS-ST-T complex associated with each triad V1, V2, V3 and V7, V8, V9 –
more particularly I have labeled 3 points on each complex: point 1, point 2 and point 3. After studying these three points, the following is clearly true: point 1 associated with V1, V2, V3 shows a positive deflection, point 1 associated with V7, V8, V9 shows a negative deflection.
Now look at point 2. The following is clearly true: point 2 associated with Leads V1, V2, V3 shows a negative deflection point 2 associated with Leads V7, V8, V9 shows a positive deflection.
Now look at point 3. The following is clearly true: point 3 associated with Leads V1, V2, V3 shows ST depression point 3 associated with Leads V7, V8, V9 shows ST elevation.
PEARL
The following is a true statement: In the setting of the acute Inferior STEMI, you sometimes will also find the acute Posterior STEMI and the acute Right Ventricle STEMI.
Question: The presence of Early Transition (R-wave >S-wave between Leads V1 & V2) may indicate which of the following (answer at bottom of post):
A. Normal Variant
B. RBBB
C. Posterior Infarction
D. All of the Above
E. None of the Above
ANSWER: D. All of the Above
Questions about this blog, becoming an educational partner or one of our products? Please Contact Us
Related ECG Blog Posts:
-
 Advanced 12-Lead ECG Interpretation Course (30 Hrs CME)$499.00
 -
 50 ECG Case Studies Course (13 Hrs CME)$145.00
 -
 Animated ECG Rhythm Interpretation Course (9 Hrs CME/CE)$125.00
 -
 STEMI Recognition Review Course (6 Hrs CME)$90.00
 -
 Intensive Triple Bundle ECG Course Suite: (52 Hrs Cat I CME/CE)Original price was: $769.00.$699.00Current price is: $699.00.
 -
 ECG Rhythms Field Guide Book$48.50
 -
 Rhythm Ruler Pocket GuideOriginal price was: $14.50.$9.95Current price is: $9.95.
 -
 HEART Ruler Mnemonic Pocket GuideOriginal price was: $15.00.$9.95Current price is: $9.95.
 -
 ACLS Prep Course (3 Hrs CME)$65.00