(C) 2023 ECGcourse.com LLC | Vernon R Stanley, MD, PhD Author | All Rights Reserved.
Please note: Content is not intended to be medical or legal advice. As always, please correlate with patient history, lab results, radiologic studies and current (and old) EKG. Also consult with FP and Cardiology when and where appropriate.
ANSWERS & Brief Discussion Below (scroll down | Part II post coming soon…)
- A Hyper Acute T-wave is classically described by the following terms, EXCEPT: E. Biphasic
- A Differential Diagnosis of T-wave peaking may include all of the following EXCEPT: B Hypokalemia
- If the T-waves are Hyperacute, this is suggestive of: A. An early injury pattern typically only a few hours in duration.
Characteristics of the T-waves of the Normal 12-lead ECG
Please review the following figure:
You will notice that the T-wave is upright and furthermore is rounded and slightly asymmetrical. It tends to rise slowly and have a steep descent. In fact, if the T-wave is symmetrical (either inverted or upright) it is suspect for ischemia or infarction, especially if it is pointed and peaked.
This change in the T-wave might occur in the very early stages of an acute MI and is characterized by a tendency of the T-wave to be high-peaked, sharp and broadened at the base and symmetrical. This subtle finding of the abnormal T-wave is one that only the discriminating eye will see, but it may be the only abnormality on the 12-lead ECG to suggest acute ischemia or infarction. It is almost as if the acute MI were “pulling up” on the T-waves with an attachment point at the center, causing a broadening of the base, sharp peaking, heightening and symmetry. When this is recognized, the T-waves are described as “hyperacute T-waves“.
The important point is NOT that you should expect yourself to always recognize symmetry vs asymmetry, because the T-wave is often not clearly depicted; but it is important that you always look for it.
The concept of symmetry is demonstrated in the illustration below which shows symmetry around the axis of rotation. For example, if you rotate the T-wave around the axis of rotation, this will reproduce the waveform.
If this mirror image symmetry is present, then this is described as symmetrical T-waves and the ECG is certainly “NOT NORMAL”. The implication of NOT NORMAL is certainly vague and nonspecific and you must know that this covers the gamut from inconsequential to serious to life-threatening. However, as the electrocardiographer, you are not so much interested in the gravity of the abnormality but simply say that the ECG is normal or not normal and to further categorize this into a specific diagnosis, if possible, such as acute MI, old MI, myocardial ischemia, LVH, LBBB, non-specific, IVCD, etc.
You will notice that the T-waves are upright (positive) in all leads of the normal 12-lead ECG, except maybe in Leads V1, avL, avF, III. These four leads in fact often have inverted T-wave and you can certainly have a perfectly normal 12-lead ECG with these inversions. However, these T-wave inversions could represent a subtle sign of ischemia. The truth will more nearly be revealed by comparison with the old ECG. It is not so important that you memorize the four leads which might normally have T-wave inversion but that you know that some leads may have T-wave inversions, and proceed to a reference manual for these specific leads.
Hence, as a part of our routine for the 12-lead ECG analysis, we must carefully scrutinize each lead’s T-wave to determine if the T-wave is upright and asymmetrical.

If this T-wave rule is violated, then you must explain why, or at least acknowledge this finding. The important point is that the ECG is not normal. It has already been seen that you can expect possible T-wave inversion as a part and parcel of LBBB or RBBB as secondary or primary T-wave changes or even the IVCD. Please reference past blog posts: RBBB (Right Bundle Branch Block) & Primary T-wave Changes – ECGcourse.com | Finding a STEMI in the presence of the Left Bundle Branch Block (LBBB) – ECGcourse.com
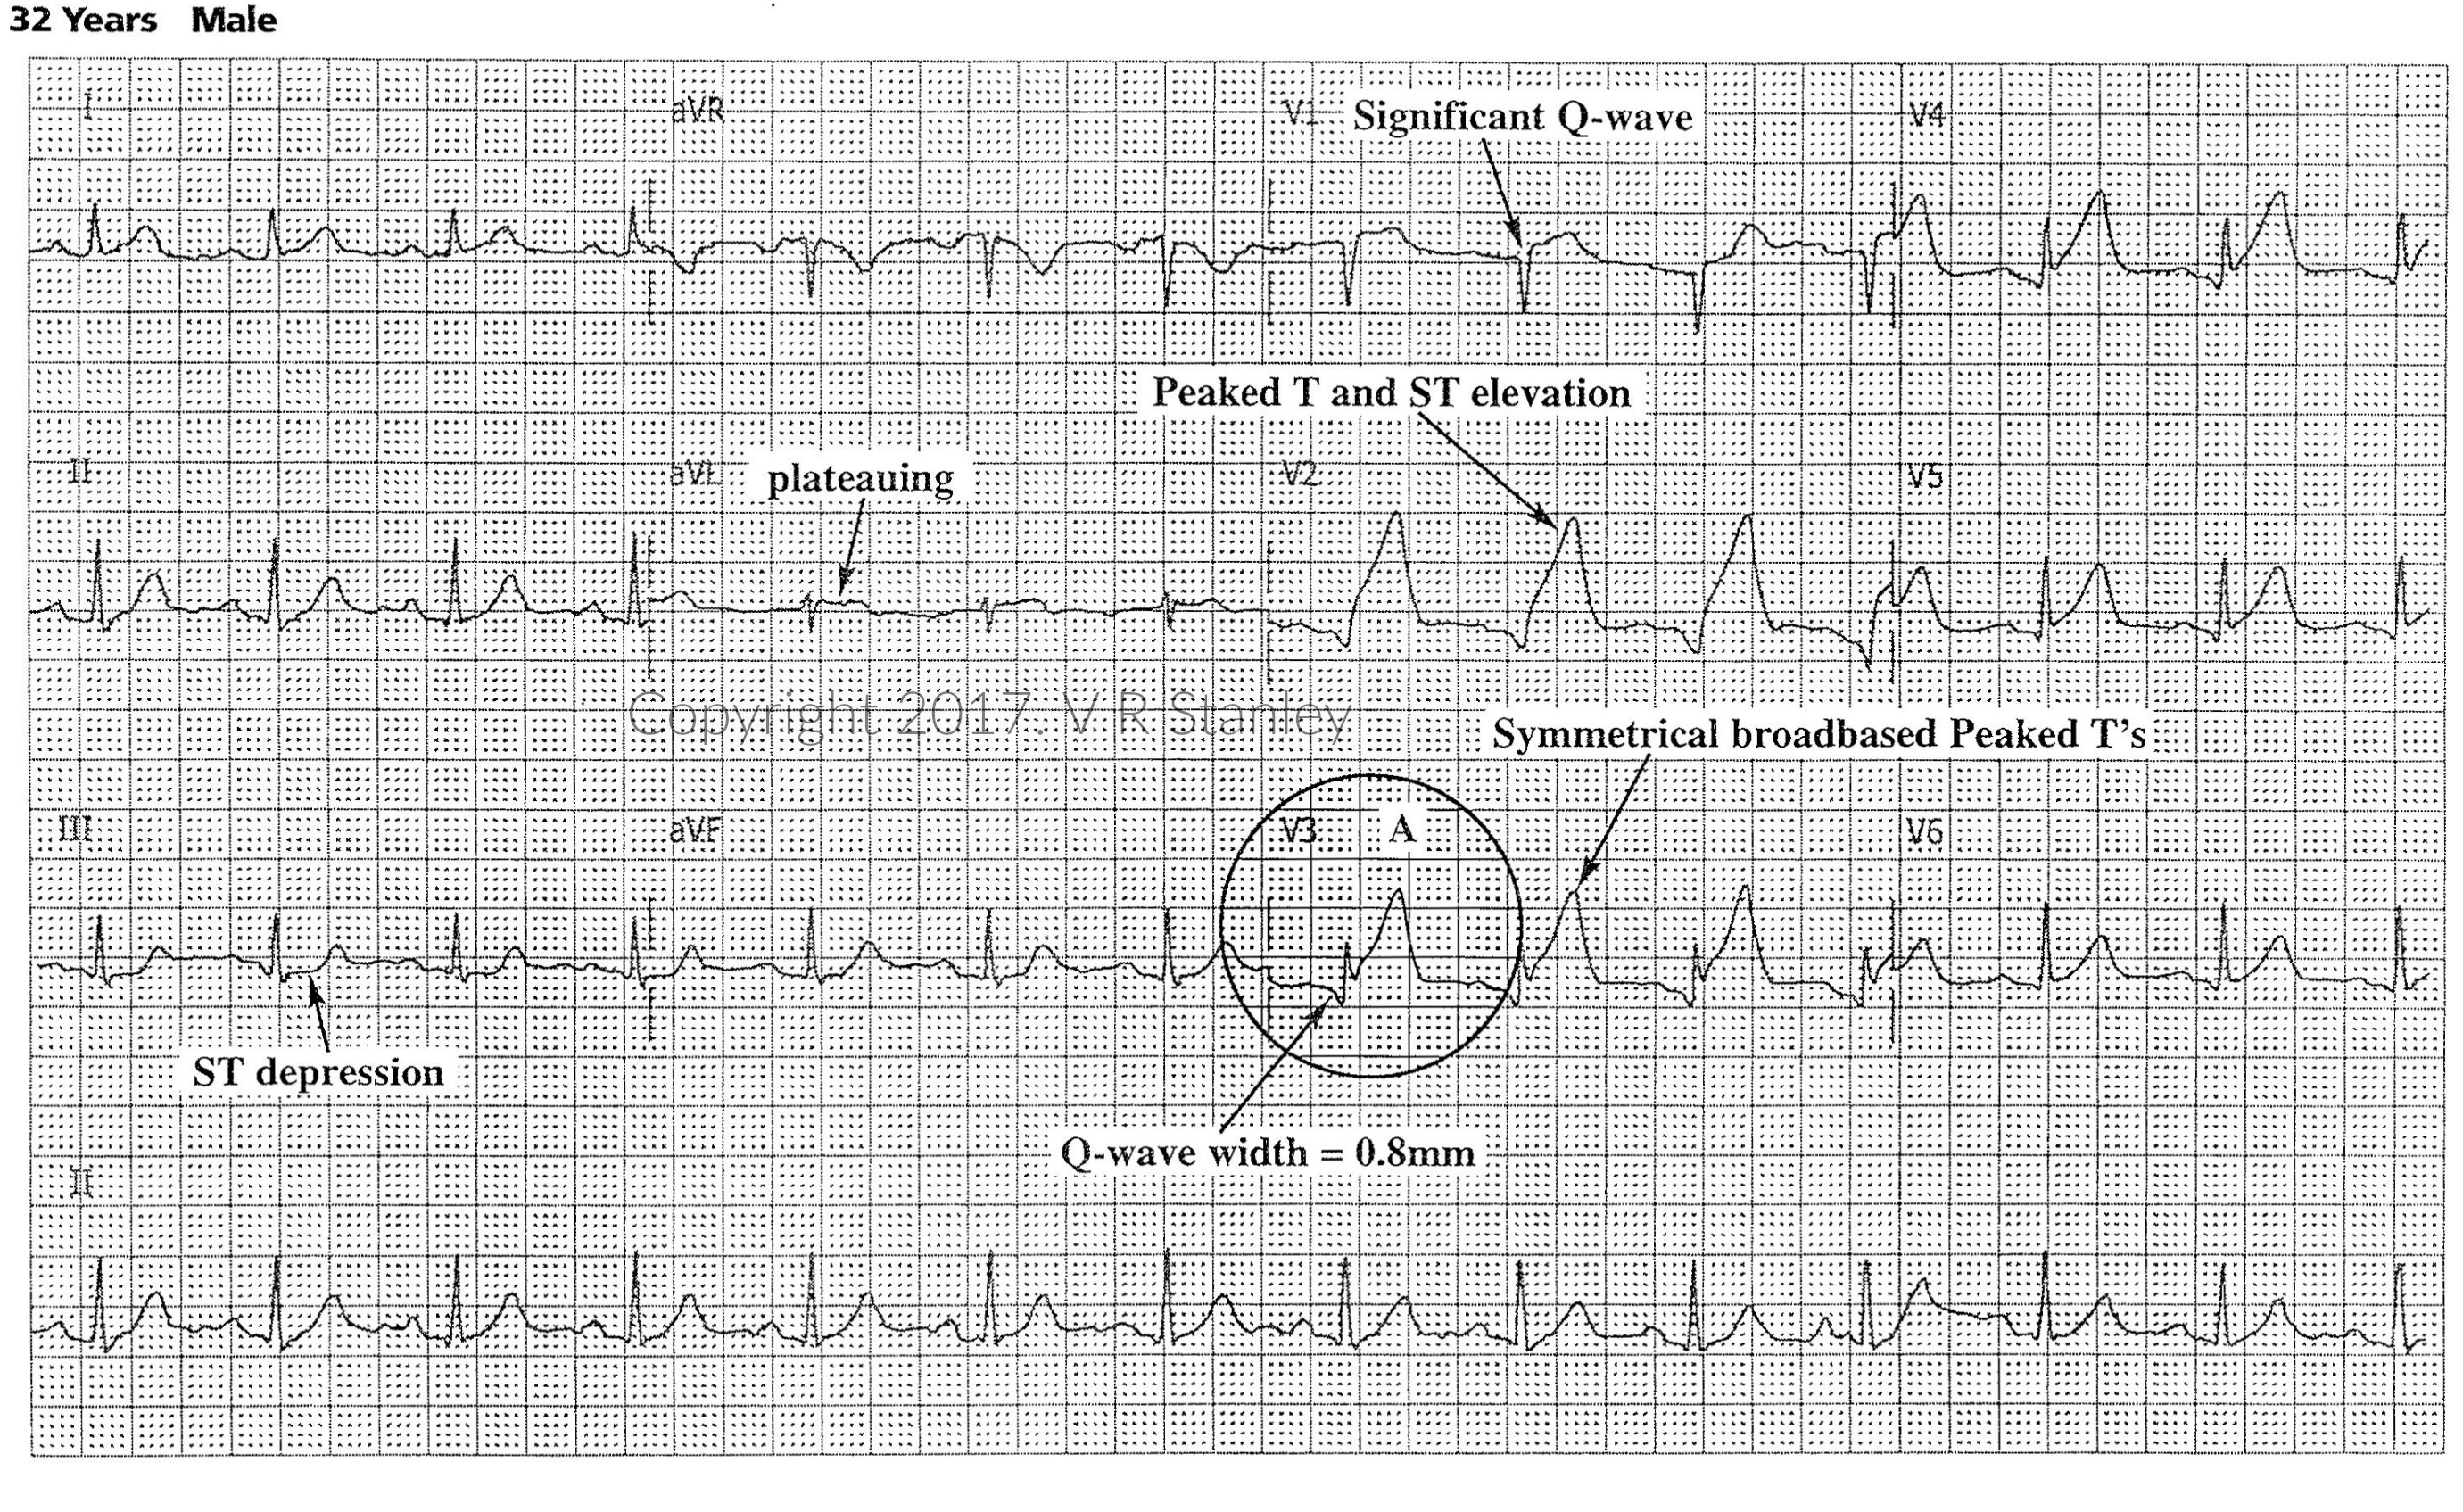
Hyperacute T-waves and Classic STEMI Patterns:
- They are often the 1st abnormality on the 12-lead ECG, within the 1st 30 minutes of vessel occlusion.
- Their presence is often transient and hence serves as a time marker in the early evolution of the STEMI
- Hyperacute Ts are typically tall, rounded peak and tending toward symmetrical, broad-based (compared to peaked Ts of hyperkalemia that are tall, sharp-peak, narrow-based (needle-like, symmetrical)
- If suspicious, repeat the ECG every 15 minutes until you detect a pattern or as clinically indicated.
Example Tracing of Hyperacute Ts
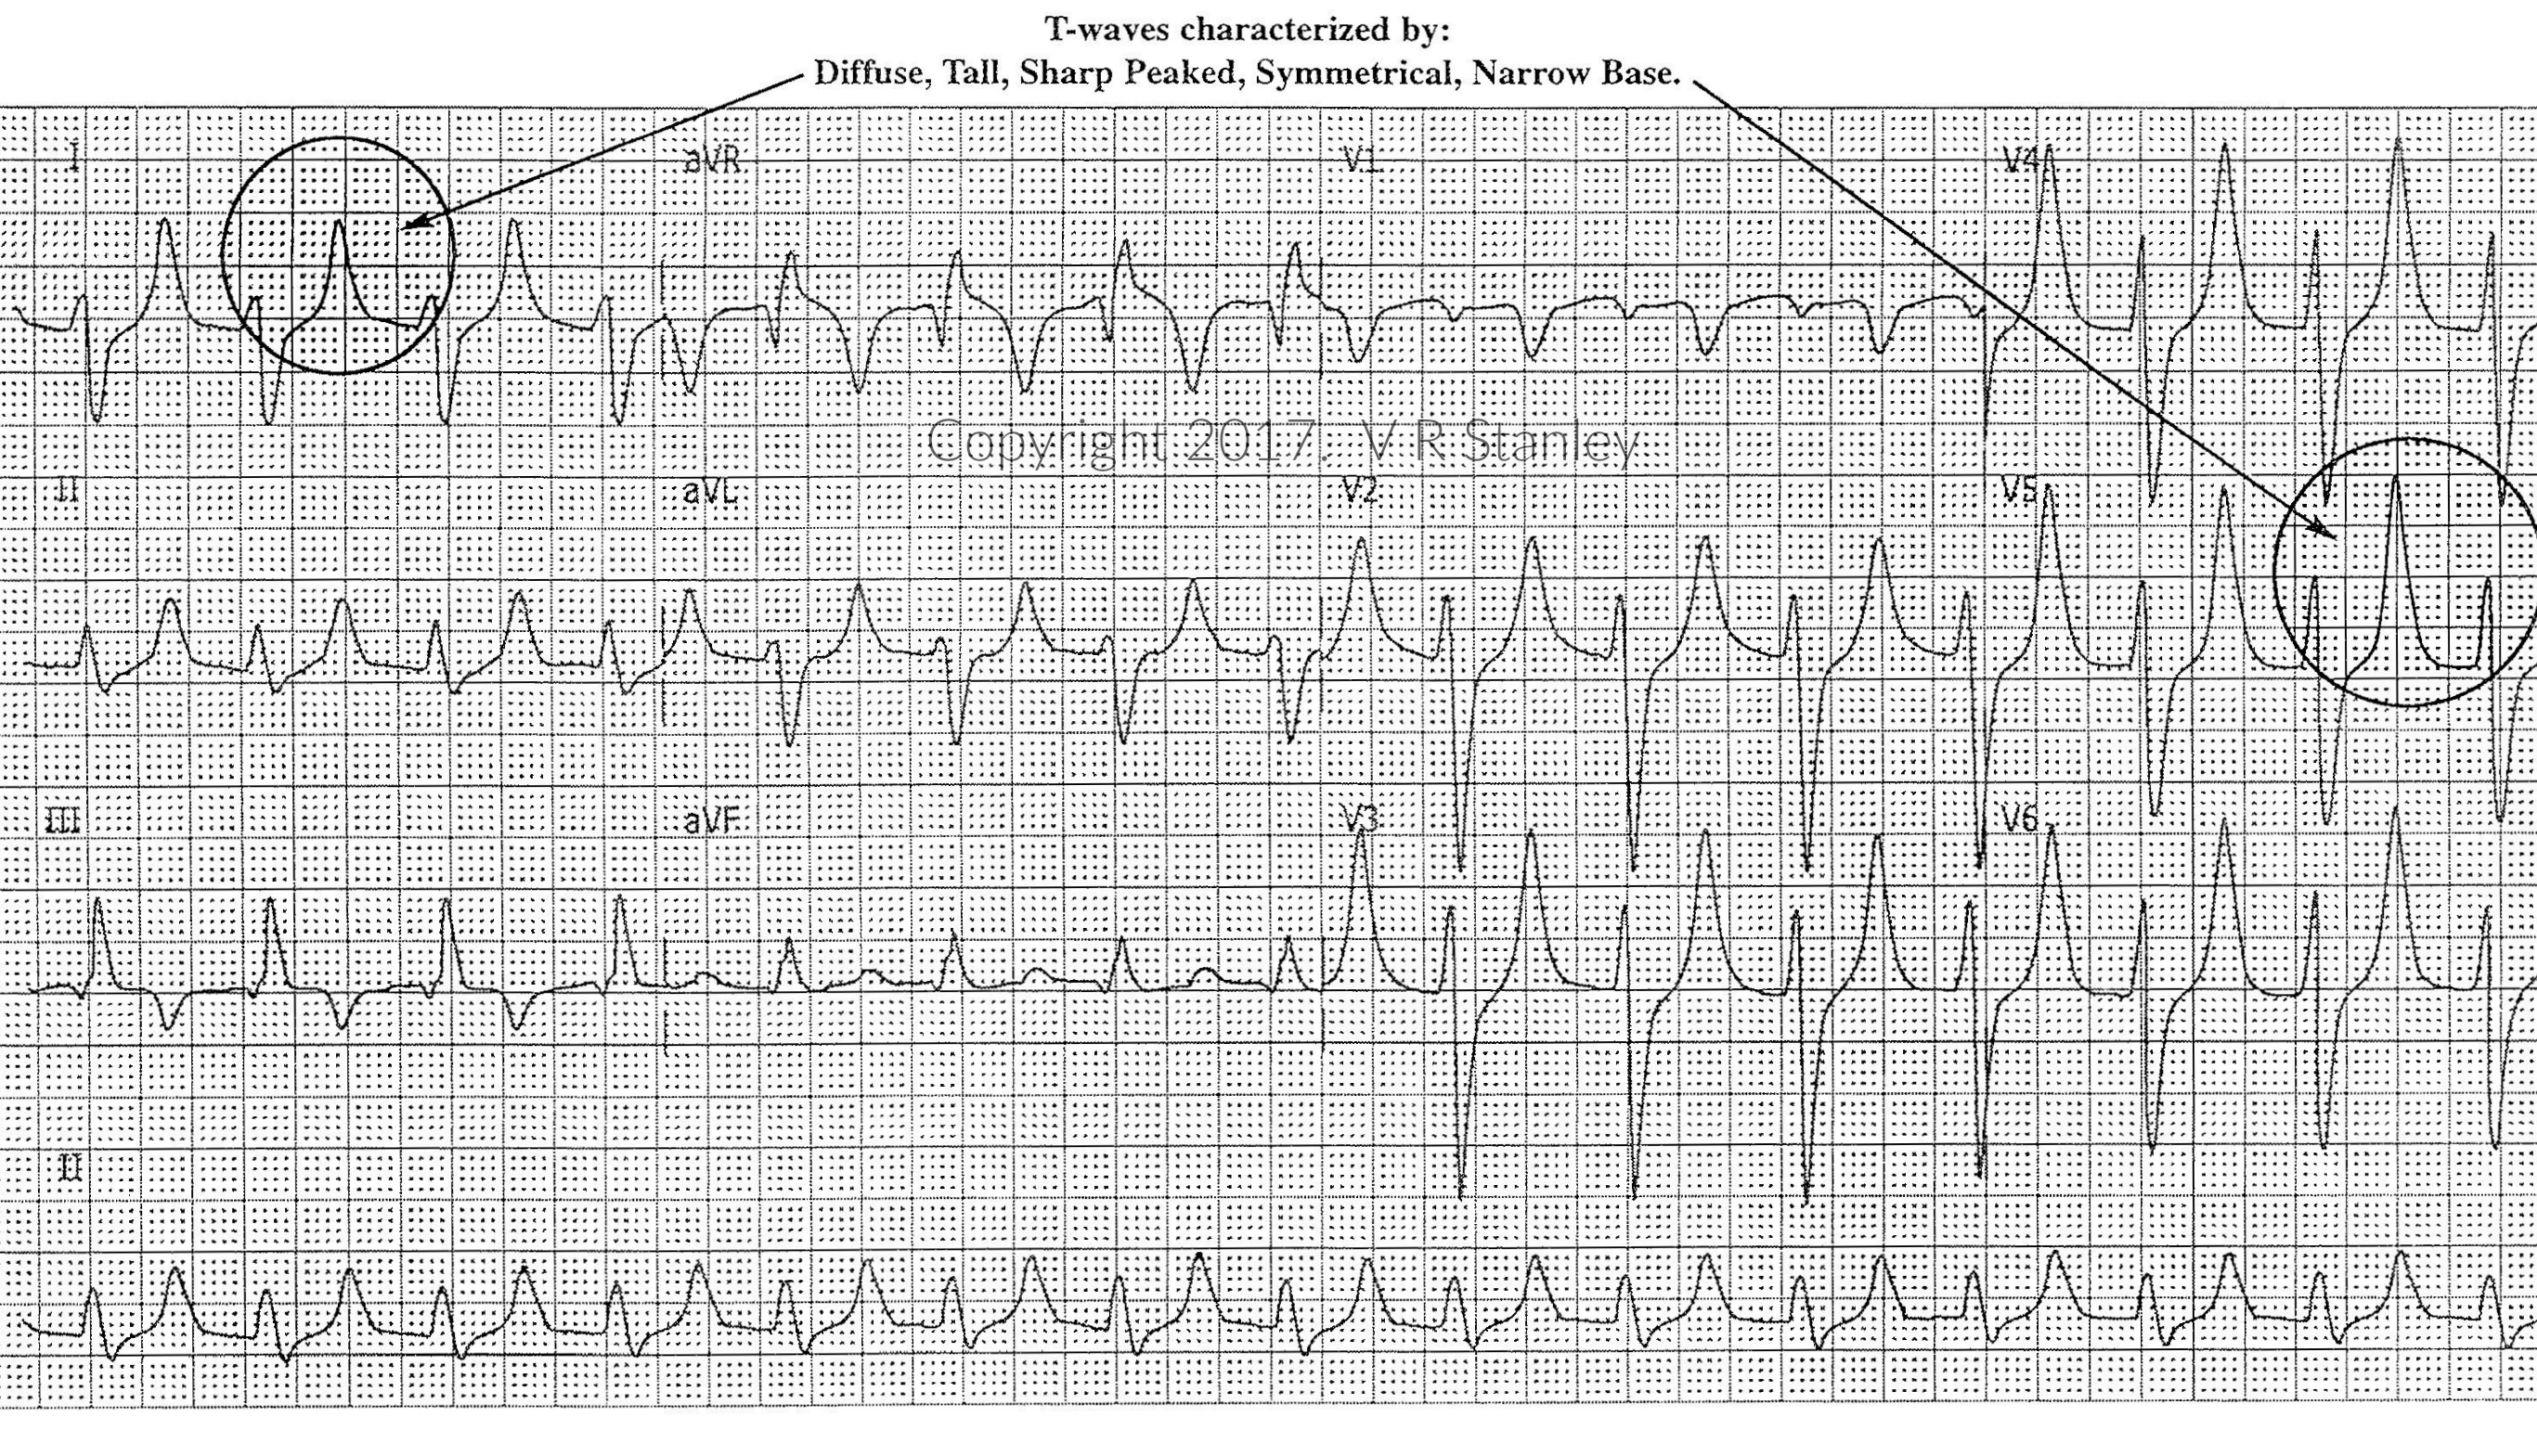
Hyperacute Ts vs Hyperkalemia
Another common “peaked Ts” cardiogram is the 12-lead ECG of hyperkalemia. In the clinical environment you will frequently encounter the patient with hyperkalemia. As the serum K+ rises, the T-wave will usually increase in height and will become…diffusely tall, sharp peaked, narrow based, symmetrical.
Example Tracing of Hyperkalemia
Specials & Newsletter SignUp
Form for Specials Page.
Stay tuned! In Part II of Differential Diagnosis of the Peaking or Hyperacute T-wave, we will analyze the following tracing…
PART II Coming Soon…
Hyperacute T-wave Differential Diagnosis
-

Advanced 12-Lead ECG Interpretation Course (30 Hrs CME)
$499.00 -

50 ECG Case Studies Course (13 Hrs CME)
$145.00 -

Animated ECG Rhythm Interpretation Course (9 Hrs CME/CE)
$125.00 -

STEMI Recognition Review Course (6 Hrs CME)
$90.00 -
Intensive ECG 3-course Suite: (49 Hrs Cat I CME/CE)
Original price was: $769.00.$699.00Current price is: $699.00. -

ECG Rhythms Field Guide Book
$48.50 -
Rhythm Ruler Pocket Guide
Original price was: $14.50.$9.95Current price is: $9.95. -
HEART Ruler Mnemonic Pocket Guide
Original price was: $15.00.$9.95Current price is: $9.95. -

ACLS Prep Course (3 Hrs CME)
$65.00


