(C) Renewed 2024 | Vernon R Stanley, MD, PhD | ECGcourse.com, LLC. All rights reserved. Co-editor: Courtney Stanley, PA-C
Before moving to the blog post below, please answer the following ECG Challenge question. (Answer provided at bottom of post.)
Question: As regards T-wave Inversion in the 12-lead ECG, T-wave Inversion:
- A. T-wave inversion should not be seen in any leads of the 12-lead
- B. T-wave inversion may occur during acute ischemia
- C. T-wave inversion may occur as a cardiac manifestation during infection with COVID-19
- D. T-wave inversion may be a normal variant in leads V1, avL, avF or III
- E. All of the Above
- F. B, C & D only
- G. B & C only
Please scroll to the bottom for the answer.
Over the past several months, we have discussed Dr Stanley’s H-E-A-R-T mnemonic. We have covered: H for Hypertrophy, E for Extent of the Intervals, A for Axis, and R for qRs-st analysis. In this final installment of the 5-part series, we will discuss T for T-wave inversion. If you missed any of the previous posts, you may review them at Dr Stanley’s Blog.
The presence of T-wave inversion in the 12-lead ECG is fraught with a long differential list. Each lead of the 12-lead should be examined carefully and, when available, comparison with an old ECG should be performed. The list of differentials for T-wave inversion includes, but is certainly not limited to the following:
- T-wave inversion associated with LVH (Left Ventricular Hypertrophy)
- T-wave inversion associated with LBBB (Left Bundle Branch Block) or RBBB (Right Bundle Branch Block), WPW (Wolff-Parkinson-White) or IVCD (Intra-Ventricular Conduction Delay)
- T-wave inversion of Infarction, Ischemia or Non-ST-elevation MI
- T-wave inversion associated with the ECG Juvenile pattern
- CNS catastrophe such as stroke or subarachnoid hemorrhage
- Pulmonary embolus
- Most recently, relatively common finding in COVID-19 patients. (If T-wave inversion a new finding, it may be associated with increased hospitalization, mechanical ventilation and increased mortality. See full article.)
In this blog we will focus briefly on the following T-wave inversion causes as is featured on Dr Stanley’s HEART Ruler Pocket Guide:
- T-wave inversion Associated with LVH
- T-wave inversion Associated with LBBB or RBBB
- T-wave inversion of Ischemia or non-ST Elevation MI
1. T-wave Inversion Associated with LVH
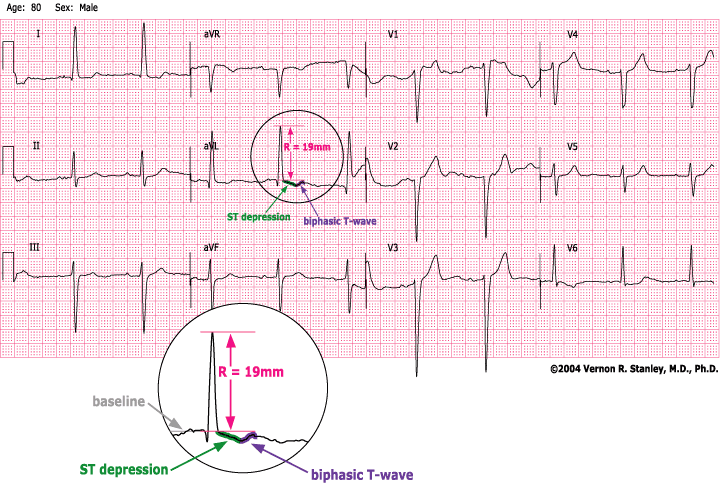
NTERPRETATION
- LVH with ST-T changes (strain); criteria R-wave = 19 mm Lead avL
- Peaked T’s and ST elevation and significant Q’s in Leads V1 andV2.
- ST depression and T-wave inversion Leads V6, I, aVL , II
DISCUSSION:
Please know that an old tracing was available. When compared, they are virtually identical.
The focus of this Case Study is the LVH pattern and its associated ST-T changes. This tracing is a particularly good example of ST-T changes that mimic the Acute Anteroseptal MI.
LESSON NOTE ON Q-WAVES AND ST-ELEVATION ASSOCIATED WITH THE LVH PATTERN
The focus of this Case Study tracing is to emphasize changes often found secondary to the LVH pattern. This tracing is a particularly good example of significantly wide Q-waves and ST elevation concave down commonly found in Leads V2, and V3. These observed ST-T-Q wave changes look like those of the acute anteroseptal ST elevation MI, but in fact these changes are probably pseudoinfarction changes.
You can clearly see how one might misinterpret this cardiogram as an acute STEMI. This potential catastrophe can be avoided or minimized by being proactive with your thinking when you recognize the LVH pattern i.e.
Be particularly vigilant with your interpretation regarding Leads V1, V2 and V3. These three leads will frequently demonstrate ST-T-Q waves that will mimic the acute ST elevation MI. The recognition of these changes associated with the LVH pattern should automatically trigger your mentality to:
- Always ask to see the old cardiogram. This might inform you that these ST-T-Q wave changes are old. This will swing you in the direction to simply conclude:
“LVH with ST -T changes
2. As a safety net of hedging, please know that it is wise to acknowledge that the observed changes could be a combination of:
A. LVH with ST-T changes
AND
B ST-T-Q changes of the acute STEMI/non-STEMI or myocardial ischemia
CLINICAL PEARL
In a given situation the practitioner must correlate clinically in order to determine the interpretation and disposition response i.e. is it simply LVH with ST-T changes or is there associated ischemia and/or infarction? This screening decision is made by careful analysis of the history, physical exam, X-ray, coronary risk factors, comparison with the old ECG and lab studies including the cardiac markers.
SUMMARY INTERPRETATION
- LVH with ST-T changes (strain)
- Cannot rule out myocardial infarction/ischemia (anterolateral) or reciprocity
- Recommend clinical correlation and comparison with old tracing
2. T-wave Inversions and Changes Associated with RBBB or LBBB
We have discussed at length in previous blog posts the distortions which the LBBB can create when analyzing the 12-lead ECG in the presence of a Left Bundle Branch Block. To review, please click here.
If you find an LBBB or RBBB you must further analyze all the T-Waves to categorize them as either Primary or Secondary.
PRIMARY & SECONDARY T-WAVE CHANGES OF THE LBBB & RBBB
SECONDARY T-WAVE CHANGES (in all leads): T-wave is upright if terminal portion of QRS complex is negative. T-wave is inverted if terminal portion of QRS complex is positive.
PRIMARY T-WAVE CHANGES (in all leads): If the above T-wave polarity rule is violated, it is described as primary T-wave changes. This is consistent with myocardial ischemia.
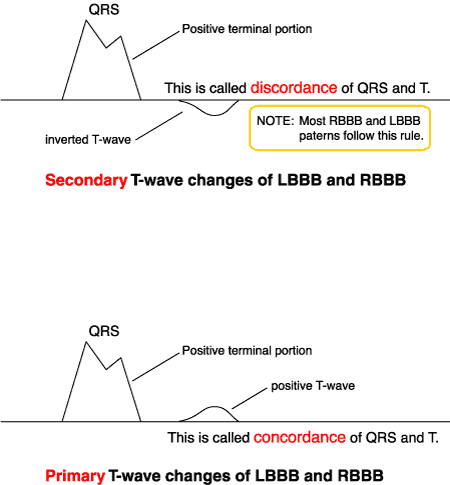
Notice above the discordance of the QRS and T-Wave of the SECONDARY T ‘s ie the terminal portion of the QRS going in the opposite direction of the T-Wave.
Notice above the concordance of the QRS and T-Wave of the PRIMARY T ‘s ie the terminal portion of the QRS going in the same direction of the T-Wave.
If Primary T-Waves are found, this is consistent with ischemia.
- If you find an LBBB, look for Primary and Secondary T’s. (If primary T-wave changes are present, consider myocardial ischemia.)
- If you find an RBBB, look for Primary and Secondary T’s. (Analyze all the Leads looking for ST-Elevation, ST-Depression, T-Wave Peaking and Significant Q’s that might suggest acute ischemia or infarction.)
PEARL: One of the greatest booby traps of electrocardiography is the LBBB. The ST-Elevations, T-wave peaking and significant Q-waves are usually due to the distortion caused by the LBBB conduction i.e. these are usually pseudoinfarction patterns. An exception to this conclusion holds if primary T-waves are present. (When evaluating the ACS patient, look for the Modified Sgarbossa Criteria to diagnose the STEMI.)
NOTE: Occasionally you will encounter a cardiogram that demonstrates a widened QRS > 0.10 seconds but otherwise does not meet the classic criteria of the LBBB or RBBB. In order to acknowledge this finding we label the cardiogram as an IntraVentricular Conduction Delay (IVCD). This is a convenient label to demonstrate that the electrocardiographer recognized the widening of the QRS complex and also that it did not fit the classic criteria pattern of the RBBB or LBBB.
Sometimes it is appropriate to label the tracing as an atypical LBBB or atypical RBBB.
3. T-wave inversion of Ischemia or non-ST Elevation MI
In this segment and case study, we will focus on the non-ST Elevation MI:
As an ICU nurse, you are asked to evaluate the tracing below of a 77-year-old male with chest tightness and shortness of breath. The admission tracing 24 hours earlier was “normal”. Your interpretation given to the private attending would be as follows:
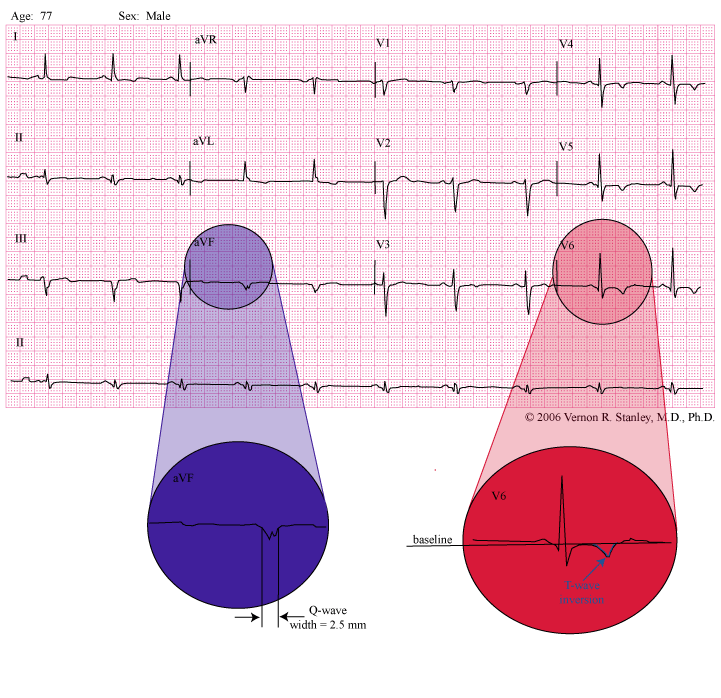
INTERPRETATION:
The significant Q-waves in Leads III and avF are consistent with inferior infarction (age unknown). It might be a normal variant unless shown to be new.
T-wave inversion Leads I, avL, V4, V5 and V6 consistent with lateral/highlateral myocardial ischemia or non-ST-elevation MI (non-STEMI). The attending should be notified immediately.
DISCUSSION:
There are two noteworthy points of this tracing:
- 1. Significantly wide Q-waves in Leads III and avF (i.e.Q-wave duration > 1mm [0.04 sec]).
- 2. T-wave inversion in Leads V4, V5, V6, I and avL.
First, let us look at the magnified Lead avF. I have labeled the Q-wave width as 2.5 mm. We will consider significantly wide Q-waves as > 0.04 sec.
DIFFERENTIAL MEANING OF SIGNIFICANTLY WIDE Q-WAVES
- 1. Myocardial infarction (usually old, although the Q-wave might develop over only a few hours during the evolution of an acute MI).
- 2. LBBB.
- 3. LVH.
- 4. WPW.
- 5. LAFB.
- 6. IVCD.
- 7. Might be a normal variant especially in Leads II, III, aVF, aVL (must have old tracing for comparison and old clinical record)
- 8. Ventricular aneurysm.
Important Special Case Regarding Significant Q-waves:
During your practice you will occasionally find significantly wide Q-waves in Leads II, III and avF, and you will find this to be normal for that patient (i.e. a normal variant). As indicated above, this conclusion can only be drawn by clinical correlation and comparison with the old cardiogram.
Now let us look at the magnified view of Lead V6. Note the colored and labeled T-wave inversion. This is also seen in Leads I, avL, V4 and V5.
DIFFERENTIAL MEANING OF T-WAVE INVERSION (partial list)
- 1. Myocardial ischemia.
- 2. Myocardial infarction (acute non-STEMI).
- 3. LVH with ST-T changes (strain).
- 4. T-wave changes secondary to LBBB, RBBB, WPW or IVCD.
- 5. Non-specific changes.
- 6. Juvenile pattern.
- 7. CNS catastrophe such as stroke or subarachnoid hemorrhage.
- 8. Pulmonary embolus.
- 9. T-wave inversions of reciprocity.
- 10. Hyperventilation syndrome.
IMPORTANT TRUISMS:
- An infarction does NOT always produce a Q-wave.
- A Q-wave does NOT necessarily reflect an MI (old or recent).
SUMMARY CONCLUSION:
As you systematically analyze a given 12-lead utilizing my H*E*A*R*T mnemonic, the letter “R” will prompt you to examine each lead looking for significantly wide Q-waves. A Q-wave has many possible meanings as listed above. The diagnosis will depend on clinical correlation, cardiac markers, and comparison with the old 12-Lead.
Please remember that a Q-wave is sometimes thought of as an old MI, but indeed this is not necessarily so; the Q-wave can develop over only a few hours time frame.
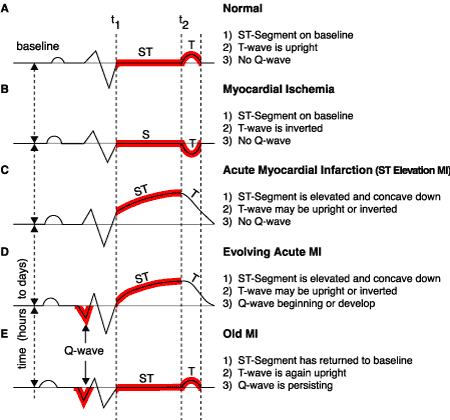
The letter “T” of the mnemonic will prompt you to scrutinize every T-wave of the 11-lead (see page 102 of my 12-lead ECG textbook). The realization is that the normal state is “all T-waves are upright (positive) except maybe Leads V1, avL, avF and III. If the T-wave is inverted, you must consider the possibility of acute myocardial infarction/ischemia.
Your conclusion will require careful comparison with the old tracing, lab and x-ray studies and clinical correlation as well as exclusion of the multiple differentials listed above.
ECG INTERPRETATION:
The significant Q-waves in Leads III and avF are consistent with inferior infarction (age unknown). It might be a normal variant unless shown to be new.
T-wave inversion Leads I, avL, V4, V5 and V6 consistent with lateral/highlateral myocardial ischemia or non-ST-elevation MI (non-STEMI). The attending should be notified immediately.
Blog Question: As regards T-wave Inversion in the 12-lead ECG, T-wave Inversion:
- A. T-wave inversion should not be seen in any leads of the 12-lead
- B. T-wave inversion may occur during acute ischemia
- C. T-wave inversion may occur as a cardiac manifestation during infection with COVID-19
- D. T-waver inversion may be a normal variant in leads V1, avL, avF or III
- E. All of the Above
- F. B, C & D only
- G. B & C only
Related ECG Blog Content:
- “H” is for Hypertrophy – ECGcourse.com
- “R” is for qRs Analysis | Early R-Wave Transition & Abnormal R-wave Progression. – ECGcourse.com
For more information on 12-lead ECG Interpretation courses offered through Dr. Stanley’s ECGcourse.com, please see our recommended products below. Also, feel free to Contact Us with questions before purchasing. Thank you for your participation!
-
Product on sale
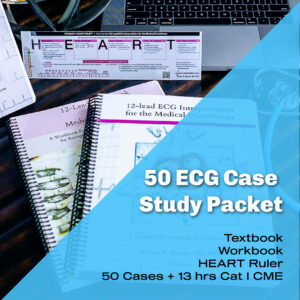 50 ECG Case Study Value Packet | Textbook, Workbook, HEART Ruler + 13 Hours Cat I CMEOriginal price was: $273.49.$136.75Current price is: $136.75.
 -
Product on sale
 BOGO: 12-lead ECG Course + 50 ECG Case Study Course (43 Hours Cat I CME/CE) | 50% OffOriginal price was: $644.00.$569.00Current price is: $569.00.
 -
Product on sale
 BOGO: 12-lead ECG Course + Animated ECG Rhythm Course (39 Hours Cat I CME/CE)Original price was: $624.00.$559.00Current price is: $559.00.
 -
Product on sale
 Unisex HEART Mnemonic Long Sleeve Black T-shirtOriginal price was: $39.50.$34.00Current price is: $34.00.
 -
Product on sale
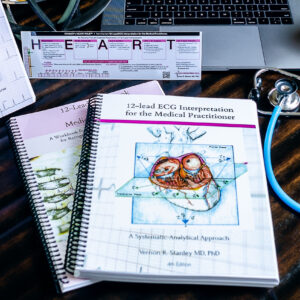 12-lead Textbook, Workbook & HEART Ruler PacketOriginal price was: $124.00.$110.00Current price is: $110.00.
 -
Product on sale
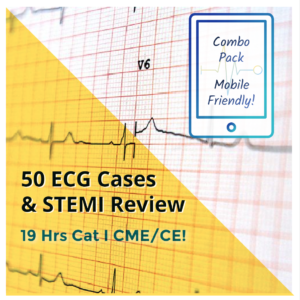 50 ECG Case Study & STEMI Review Combo Pack (19 Hrs CME)Original price was: $235.00.$199.00Current price is: $199.00.
 -
Product on sale
 Starter Online ECG 3-course Suite (22 Hrs CME | ACLS Prep + STEMI + 50 Cases)Original price was: $300.00.$265.00Current price is: $265.00.
 -
Product on sale
 Women’s HEART Acronym Fitted T-ShirtOriginal price was: $28.99.$24.00Current price is: $24.00.
 -
Product on sale
 Cheat Sheet Combo Pack: HEART Mnemonic + ECG Rhythm RulerOriginal price was: $29.00.$18.00Current price is: $18.00.
 -
Product on sale
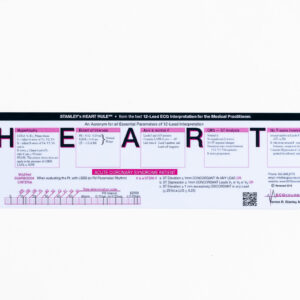 HEART Ruler Mnemonic Pocket GuideOriginal price was: $15.00.$9.95Current price is: $9.95.
 -
Product on sale
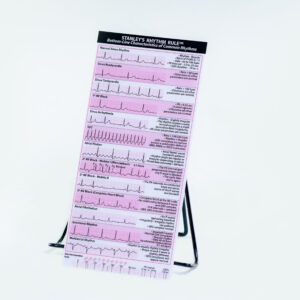 Rhythm Ruler Pocket GuideOriginal price was: $14.50.$9.95Current price is: $9.95.
 -
Product on sale
 Intensive Triple Bundle ECG Course Suite: (52 Hrs Cat I CME/CE)Original price was: $769.00.$699.00Current price is: $699.00.
Specials & Newsletter SignUp
Form for Specials Page.
3 Responses